Job Families
The Australian Public Service Commission ‘job family’ model groups functionally similar jobs that perform related tasks and require similar or related skills and knowledge. The model classifies jobs at three levels; by Family, Function and Role. There are twenty job families, which are broken down into clusters of job functions and further into job roles. In this chapter, the analysis has focused at the job family and job role. For more information on the job family model, please refer to job family model.
As at 31 December 2020, 35 agencies supplied job family data relating to 125,860 (85%) of APS employees. The high number of roles mapped to the job family model to date provides a reliable dataset for statistical modelling and forecasting.
More than a quarter of the APS work in the Service Delivery job family (27.2%). Other job families that employ significant numbers of APS staff are Compliance and Regulation (12.1%), Administration (8.0%) and ICT (6.5%) (APSED December 2020 Table 29).
Job Roles
There were 376 distinct job roles in the APS at 31 December 2020. The Call or Contact Centre role remains the most common type of work in the APS (16,730 or 13.3%). Staff working in Call or Contact Centre roles are mostly employed by Services Australia (97.9% of Call or Contact Centre roles), although the Department of Agriculture, Water and the Environment; the Department of Education, Skills and Employment; the Department of Veterans’ Affairs and the Department of Home Affairs also have a small number of jobs in this role. Other common APS job roles include Compliance Case Management (5,910 or 4.7%), Strategic Policy Advice and Development (5,770 or 4.6%) and Customer Support (5,649 or 4.5%).
Gender
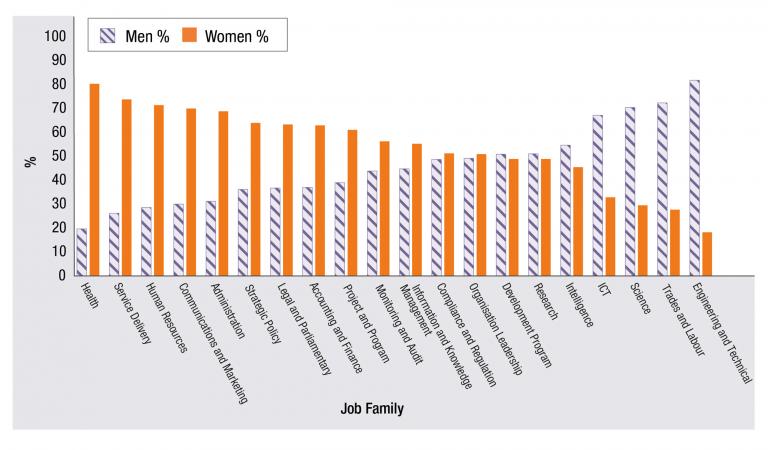
Many job families have an uneven gender representation (Figure 5.1). There are a high proportion of females employed in a number of job families including Health (79.8%), Service Delivery (73.0%), Human Resources (71.3%) and Communications and Marketing (69.9%). In contrast, males are more highly represented in technical job families such as Engineering and Technical (83.0%), Trades and Labour (73.4%), Science (69.6%) and ICT (66.0%).
Figure 5.1. Proportion of men and women by job family

Location
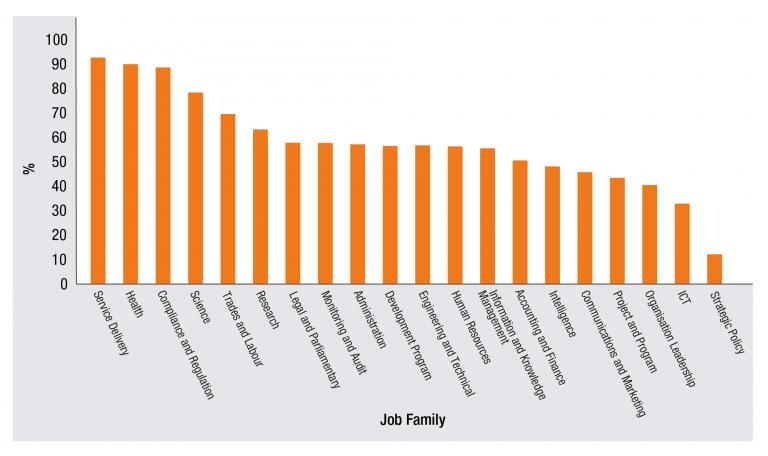
The geographic distribution of job families across Australia reflects a focus on service delivery to citizens. Figure 5.2 shows the Service Delivery job family has higher proportion of employees located outside the Australian Capital Territory. For example, 91.8% of employees working in Service Delivery work outside the Australian Capital Territory. Other job families that are concentrated outside the Australian Capital Territory include Health (90.0%), Compliance and Regulation (88.0%) and Science (79.4%). Job families commonly represented in the Australian Capital Territory are Strategic Policy (89.0%), ICT (68.3%), Organisational Leadership (64.1%) and Communications and Marketing (57.4%).
Figure 5.2 Proportion of job families located outside the Australian Capital Territory

Classification
Employees at the APS 1 to 4 levels are mostly clustered in the Administration, Compliance and Regulation, and Service Delivery job families. Despite dropping by nearly 10% over the course of 2020, the bulk of APS 1 employees work in Administration (63.1%), with 61.5% in the Administrative Support role. The proportion of APS 1 staff working in Customer Support positions increased from 12.6% to 21.1%, driven by the response of the government to COVID-19. More than half (53.4%) of APS 2 to 4 staff work in Service Delivery while a further 17.7% are employed in Compliance and Regulation. There is a much greater spread across job families for APS 5 and APS 6 classifications, although a significant proportion are still employed in Service Delivery (18.5%) and Compliance and Regulation (11.2%). Staff at the EL 1 and EL 2 classifications are employed across most job families with a significant proportion working in Strategic Policy (12.5%), ICT (11.0%), Project and Program (10.5%) and Organisational Leadership (9.6%). The vast majority of SES work in Organisational Leadership (92.0%) (APSED December 2020 Table 32).
Non-ongoing employees
Most non-ongoing employees work in three job families: Service Delivery (54.4%), Compliance and Regulation (10.9%) and Administration (9.9%). Casual employees are even more concentrated within the Service Delivery (69.9%) and Compliance and Regulation (8.2%) job families. The proportion of casual staff in Service Delivery increased from 60.0% to 69.9% during 2020, whereas the Administration job family saw a decline in same from 20.7% to 11.3%. The Call, Contact or Smart Centre role remains the most represented type of work for casual employees at 37.1%, despite the sharp increase in Customer Support numbers from 18.8% to 31.4% over 2020. Casual staff in Administrative Support has almost halved from 20.2% to 11.1% over 2020.
Movement between agencies
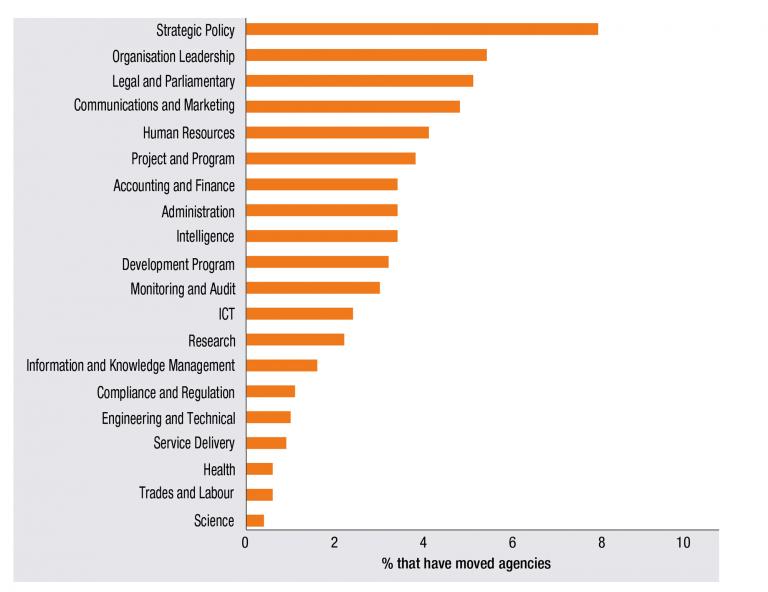
During the 2020 calendar year, 2,595 ongoing employees have moved agencies (including temporary movements) out of the 102,664 ongoing employees with recorded job family details at December 2019. Analysis shows that more specialised technical roles tend to have lower external mobility than generalist job family roles (Figure 5.3). The Strategic Policy (7.9%) job family had the highest level of mobility, followed by Organisational Leadership (5.4%). The job families with the lowest mobility of less than 1% are Trade and Labour, Science, Service Delivery and Health. Note that not all employees have moved to the same job family in their new agency.
Figure 5.3 Proportion of employees by job family that have moved agencies


