Size and Shape of the APS
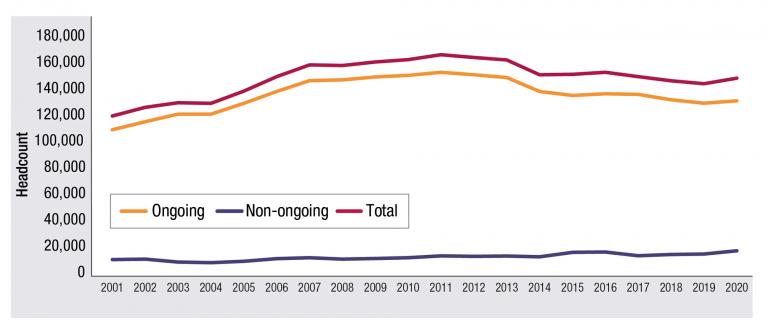
At 31 December 2020, there were 148,736 employees in the Australian Public Service (APS). This was an increase of 4,188 employees (2.9%) from the same time in 2019. In the first six months of 2020, there was an increase of 5,926 (4.1%) APS employees, including 3,547 non-ongoing employees, when the APS was responding to the bushfire emergency and the outbreak of COVID-19. From 30 June 2020 to 31 December 2020, there was a decrease of 1,738 (1.2%) employees.
APS employee numbers have fallen by 11.1% from their peak of 167,339 in June 2012.
Figure 2.1: APS employee headcounts, December 2001–December 2020
At 31 December 2020, the APS included:
- 131,443 ongoing employees (88.4%)
- 17,293 non-ongoing employees (11.6%), of which:
- 8,570 were employed for a specified term or task
- 8,723 were employed on an irregular or intermittent basis, known as ‘casual’ employees.
Fluctuations in the overall headcount occur for many reasons including seasonal patterns, business and government requirements and demand. The largest increases (excluding Machinery of Government changes) over the 2020 calendar year were:
- The Australian Taxation Office had a total increase of 2,378. This figure includes an increase of 704 ongoing and 1,674 non-ongoing employees
- Services Australia had an overall increase of 471 staff, driven by an increase of 1,228 non-ongoing employees
- The Department of Defence had a total increase of 358, of which 301 were ongoing and 57 were non-ongoing.
The largest decreases (excluding Machinery of Government changes) over the 2020 calendar year were from two agencies:
- The Australian Electoral Commission had a total reduction of 413. This figure included a decrease of 32 ongoing and 381 non-ongoing employees
- The Department of Agriculture, Water and the Environment had a total reduction of 347. This figure included a decrease of 37 ongoing and 310 non-ongoing employees.
At 31 December 2020, the largest four agencies in the APS accounted for 55.8% (82,985 employees) of the total APS workforce. This includes Services Australia (20.7%), the Australian Taxation Office (14.0%), the Department of Defence (11.6%) and the Department of Home Affairs (9.5%) (APSED December 2020 Table 5).
During the 2020 calendar year, there were 39,299 employee movements between APS agencies due to Machinery of Government changes (Appendix 2). The majority of these transfers were into:
- Services Australia from the Department of Human Services (30,209)
- The Department of Agriculture, Water and the Environment from the Department of Agriculture (5,053)
- The Department of Education, Skills and Employment from the Department of Employment, Skills, Small and Family Business (2,188)
- The Department of Infrastructure, Transport, Regional Development and Communications from the Department of Communications and the Arts (568)
- The Department of Industry, Science, Energy and Resources from the Department of Environment and Energy (523).
Sport Integrity Australia (established on 1 July 2020) replaced the Australian Sports Anti-Doping Authority. A total of 309 employees moved to the Sport Integrity Australia of which 297 came from Australian Sports Anti-Doping Authority and 12 from the Department of Health.
During the 2020 calendar year, a number of other changes occurred to the APS structure that had an effect on the spread of headcounts across the APS. See Appendix 2 for details of these coverage changes, along with a historical breakdown of employee numbers moving in and out of coverage of the Public Service Act 1999 from 2001.
Ongoing
The number of ongoing employees has increased by 1,721 since 31 December 2019. Ongoing employees make up 88.4% of the APS workforce, down from 89.7% in 2019. The proportion of ongoing employees has changed little over the last 20 years, hovering around 90%.
Non-ongoing
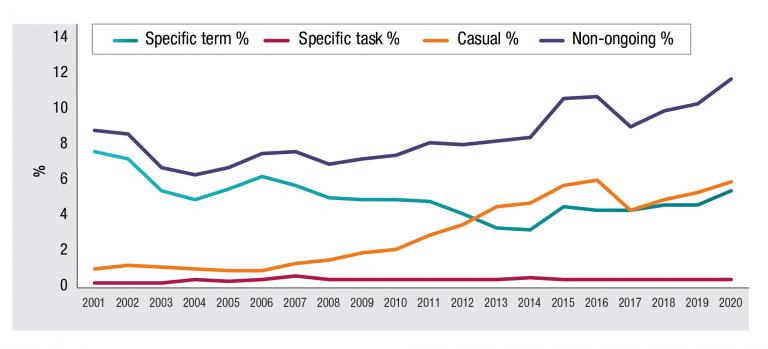
The number of non-ongoing employees has increased by 2,467 over the 2020 calendar year and as at 31 December 2020 equated to 11.6% of the APS. The majority of this increase occurred in the first half of 2020. Non-ongoing employment consists of three distinct sub-groups: specific term, specific task, and irregular or intermittent (casuals). Of the non-ongoing employees, casuals represented 50.4%, while specified term employees made up 46.2% at 31 December 2020.
The proportion of casuals as part of the whole APS workforce has risen since 2006 (Figure 2.2). As at 31 December 2020, the proportion of casual employees was 5.9%, up from 5.3% in December 2019. Agencies that employed a high number of casuals as at 31 December 2020 were Services Australia (2,953, 33.9%), the Australian Taxation Office (2,693, 30.9%), the Australian Electoral Commission (731, 8.4%) and the Department of Agriculture, Water and the Environment (426, 4.9%). Almost all casual employees (96.8%) are engaged at the APS 1–4 classifications.
Figure 2.2: Composition of non-ongoing employees, December 2001 – December 2020
APS Characteristics
Age Profile
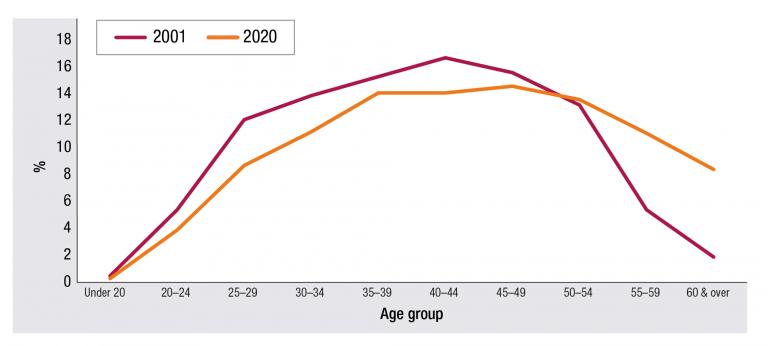
The average age of APS employees was 43.6 years as at 31 December 2020 (APSED December 2020 Table 86). Average age has increased steadily from 40.1 years in 2001. This is in line with the trends in ageing across the general Australian workforce (ABS 3101.0 – Australian Demographic Statistics, June 2020). The proportion of the APS population that are 50 years or older has increased from 20.5% in 2001 to 33.1% in 2020 (Figure 2.3). At 31 December 2020, there were 8.4% of APS employees aged 60 years and above. In 2001, there was a higher proportion of employees under the age of 50 years compared to 2020 (Figure 2.3). The number of employees under the age of 30 has declined from 18.0% in 2001 to 12.8% in 2020 (APSED December 2020 Table 26).
Figure 2.3: Proportion of age groups between 2001 and 2020
Classification Structure
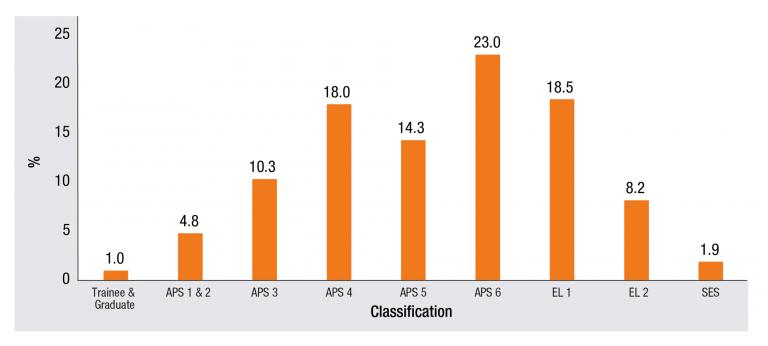
At 31 December 2020, the most common classification across the APS was APS 6 (Figure 2.4). The proportion of APS 6 employees has increased from 18.1% in 2001 to 23.0% in 2020. In 2001, the most common classification was APS 4 (24.4%) and in 2020 this classification represented only 18.0% of employees. In December 2020, the number of employees at the APS 4 classification fell behind the EL 1 classification (18.5%) for the first recorded time. (APSED December 2020 Table 11).
Figure 2.4: Proportion of APS employees by classification, at 31 December 2020
Geographic distribution of the APS
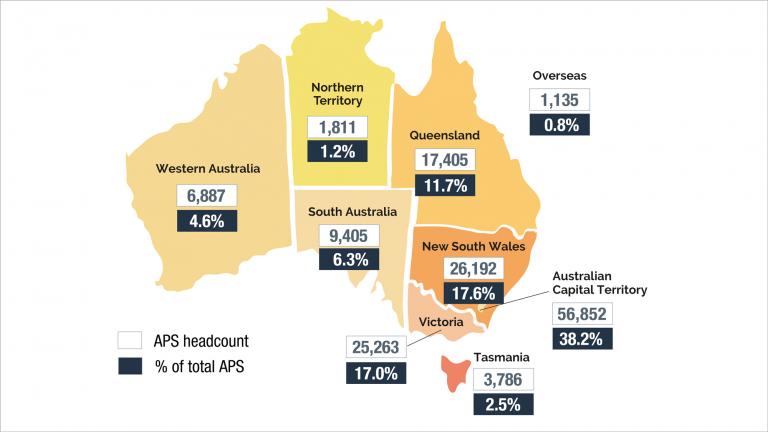
At 31 December 2020, the largest number of APS employees were located in the Australian Capital Territory (56,852), which represented 38.2% of the whole APS (Figure 2.5). Collectively, the three largest states by population (New South Wales, Victoria and Queensland) made up just over 46% of the APS workforce with a total of 68,860 employees.
Figure 2.5: APS employee headcounts and proportion by States and Territories at 31 December 2020
Regional distribution of APS
As at 31 December 2020, almost one in seven (20,186) or 13.6% of APS employees were located in regional areas outside capital cities. This is a drop from 14.0% from December 2019, which represents 80 fewer employees. The proportional drop in employees from the regions is mostly due to the increase in employees in the Australian Capital Territory (+1,423) and other cities (+3,081). The growth in employee numbers outside of capital cities has predominantly occurred in Victoria (APSED December 2020 Table 16).
In regional areas, New South Wales had the highest proportion of employees at 42.2%, followed by Queensland (25.0%) and Victoria (21.5%). The proportion of the APS working in the capital cities (other than Canberra) has declined from 52.8% in 2003 to 47.4% in 2020 (APSED December 2020 Table 16).
International service
A total of 1,135 APS employees were located overseas at the end of the 2020 calendar year. This is a drop of 236 (17.2%) from the previous year. Agencies that employed large proportions of overseas staff included 802 employees in the Department of Foreign Affairs and Trade (70.7%), 127 in the Department of Defence (11.2%), 122 in the Department of Home Affairs (10.8%) and 54 in the Australian Trade and Investment Commission (4.8%) (APSED December 2020 Table 13).


