The APS at a glance
The APS has a wide range of responsibilities relating to economic management, national security, health, aged care, employment, education, culture and the arts, families and communities, immigration, taxation, and the environment.
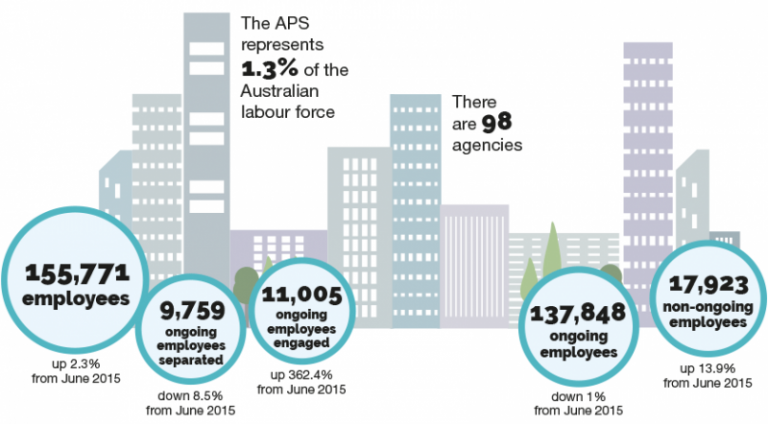
Information on this chart: The APS represents 1.3% of the Australian labour force. There are 98 agencies. 155,771 employees - up 2.3% from June 2015. 9,759 ongoing employees separated - down 8.5% from June 2015. 11,005 ongoing employees engaged - up 362.4% from June 2015. 137,848 ongoing employees down 1% from June 2015. 17,923 non-ongoing employees - up 13.9% from June 2015.
With the exception of APS 1, EL 1 and EL 2 classifications, the number of employees in all classifications increased from 2015 to 2016. The number of APS 3 employees increased by 1,626 (8.4%) and the number of Trainees increased by 299 (140.4%).
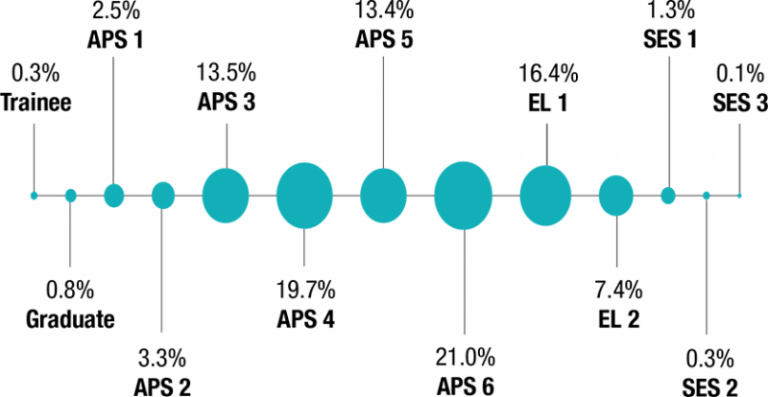
Information on this chart: 0.3% Trainee, 0.8% Graduate, 2.5% APS 1, 3.3% APS 2, 13.5% APS 3, 19.7% APS 4, 13.4% APS 5, 21.0% APS 6, 16.4% EL 1, 7.4% EL 2, 1.3% SES 1, 0.3% SES 2, 0.1% SES 3
APS employee representation
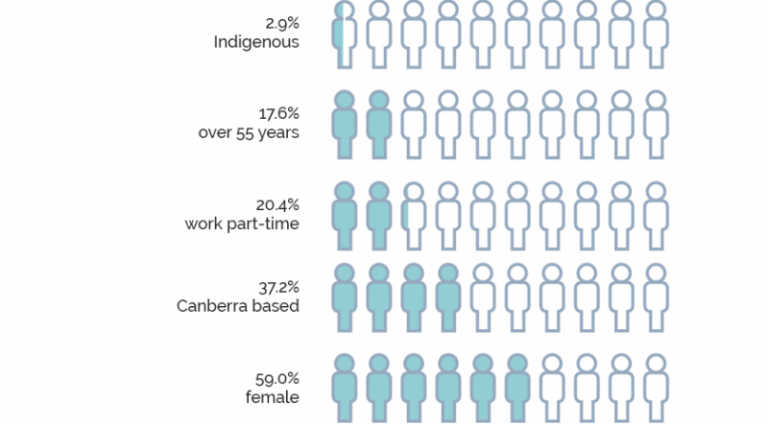
Information on this chart: 2.9% Indigenous, 17.6% over 55 years, 20.4% work part-time, 37.2% Canberra based, 59.0% female
The proportion of ongoing APS employees aged 50 years of age and over has grown significantly over time, increasing from 21.2% of ongoing employees in June 2002 to 32.3% at June 2016.
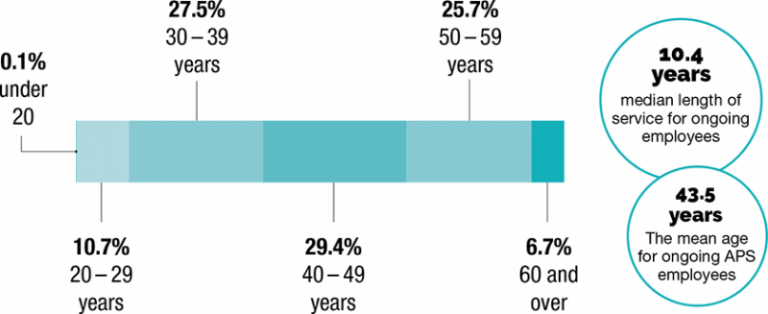
Information on this chart: 0.1 % under 20, 10.7% 20-29, 27.5% 30-39, 29.5% 40-49, 25.7 50-59, 6.7% 60 and over
By location
The highest proportion of APS employees are based in the ACT, with 59.9% of all EL employees and 72.9% of all SES employees in the ACT.
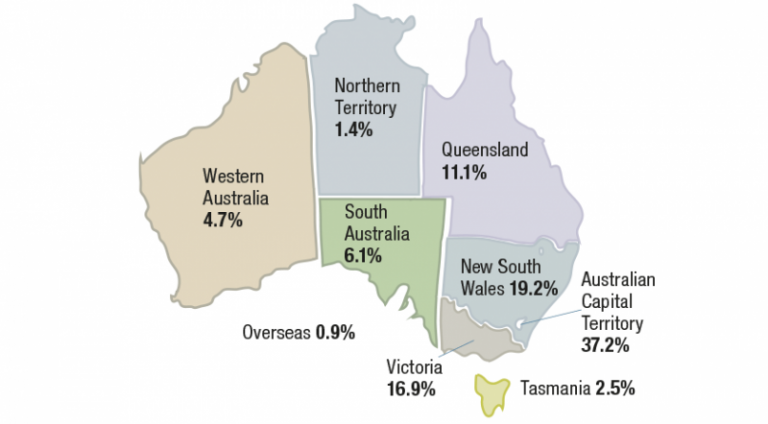
Information on this chart: Western Australia 4.7%, Northern Territory 1.4%, Queensland 11.1%, New South Wales 19.2%, Australian Capital Territory 37.2%, Victoria 16.9%, Tasmania 2.5%, South Australia 6.1%, Overseas 0.9%


