Chapter 3: Your APS
Who we are
…diversity in the public service may also contribute to national cohesiveness. When all groups of society see themselves represented in government and that the reform policies and programmes are close to their needs and cultural identity, their commitment to the national project may be enhanced.’[131]
As at 30 June 2020, 150,474 people were employed in the APS across 98 agencies in 14 portfolios, an increase of 3,692 (2.5%) APS employees since 30 June 2019.[132]
The APS operates in more than 567 locations across Australia and the globe. Women make up 60% of the APS, and Aboriginal and Torres Strait Islander people make up 3.5% of the workforce. Employees who identify as living with disability make up 4.0% of the APS, 17% of employees speak a language other than English, and 22% were born overseas.
Ongoing and non-ongoing employees
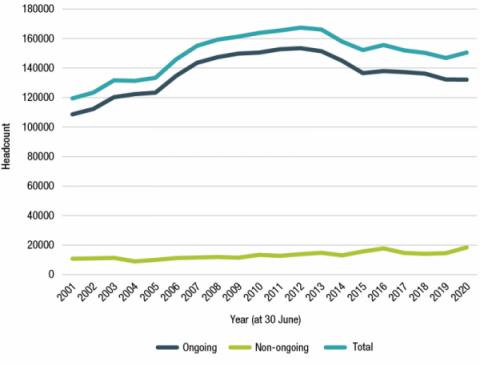
At 30 June 2020 there were 132,101 ongoing employees making up 87.8% of the APS workforce, a decrease of 117 from 30 June 2019. The proportion of ongoing employees in mid-2020 was the lowest it has been in the last 20 years.
There were 18,373 non-ongoing employees[133] in the APS, an increase of 3,809 over the 2019-20 financial year, representing 12.2% of the APS.
Most of this increase occurred between 1 January and 30 June 2020 during the bushfire emergency and the COVID-19 outbreak. The number of non-ongoing employees in the APS is the highest it has been in the last 20 years.
Of the non-ongoing employees, 7,755 (42.2%) were employed for a specified term or task and 10,618 (57.8%) were employed casually. The casual workforce currently accounts for 7.1% of the APS workforce, an increase of 6.3 percentage points since 2001.
The largest net additions of employees over the 2019-20 financial year[134] were in the following agencies:
- The ATO increased its workforce by 2,084 employees. This figure includes an increase of 141 ongoing and 1,943 non-ongoing employees
- Services Australia increased by 1,242 employees, driven by an increase of 1,776 non-ongoing employees
- The National Disability Insurance Agency increased by 906, of which 576 were ongoing employees.
Figure 3.1: APS employee headcount over time, ongoing/non-ongoing/total (2001 to 2020)

Classification profile
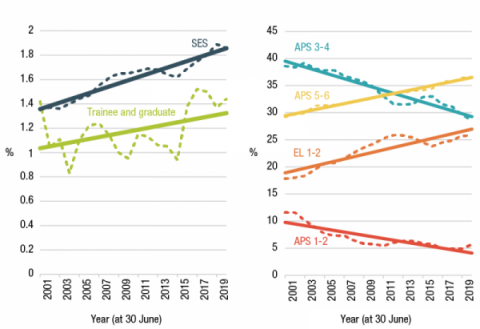
At 30 June 2020, the most common classification was APS 6. Since 2001, the proportion of APS 6 employees has increased from 17.8% to 22.6% in 2020. In 2001, the most common classification was APS 4 (24.7%). In 2020, this classification represented 18.1% of employees.
Figure 3.2: Changing proportion of employees by classification (2001 to 2020)

What we do and where we work
The APS is diverse, with wide-ranging functions and responsibilities including policy, program and service delivery and regulatory functions.
On 1 February 2020, the Government reduced the number of departments from 18 to 14, with the aim of streamlining delivery and fostering greater collaboration on complex policy challenges.[135] Other major structural changes over 2019-20 included the establishment of the National Indigenous Australians Agency, and the transition of the Australian Securities and Investments Commission to a non‑APS agency no longer covered by the Public Service Act 1999. In total, over 8,000 employees followed the movement of functions through these changes.
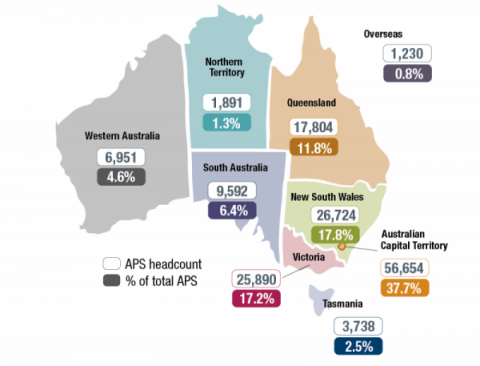
At 30 June 2020, the 4 largest agencies in the APS accounted for 56% (84,217 employees) of the total APS workforce: Services Australia (21.1%), the Australian Taxation Office (13.9%), the Department of Defence (11.6%) and the Department of Home Affairs (9.3%).
More than a quarter of the APS work in service delivery (28.9%). The most common type of work in the APS is in the call or contact centre job role (14.6%). The majority of employees working in service delivery (92.6%) and health (90.3%) job families are located outside of the ACT, reflecting their citizen-facing nature.[136]
Figure 3.3: APS employee numbers by location (30 June 2020)

At 30 June 2020, 14.0% of APS employees were located in regional areas outside capital cities. While this figure has increased since June 2012 from 12.2%, the proportion has remained constant since 2016. The growth in employee numbers outside of capital cities has predominantly occurred in New South Wales.
The proportion of the APS working in capital cities (apart from Canberra) has declined from 55.0% in 2003 to 47.5% in 2020.
[131] OECD. (2009). Fostering diversity in the Public Service.
[132] See Appendix 2 for a full list as at 30 June 2020
[133] Non-ongoing employees consist of 3 sub-groups: specific term, specific task, and irregular or intermittent (casuals).
[134] Excluding MoG changes
[135] The Hon Scott Morrison MP. (2019). Media Release: New structure of Government Departments
[136] Appendix 4 provides more information on the Job Family Model. including job roles by location.


