Diversity and inclusion
For the APS, a diverse workforce is one way to remain strongly connected to the people of Australia.
A commitment under the APS reform agenda, the APS aims to increase diversity ‘so the APS itself reflects and understands the people and communities it serves, recruiting more people from outside the APS and welcoming different views and perspectives’.[137]
Supporting Australia’s recovery from the COVID-19 pandemic will require policies, services and programs that meet the needs of a diverse community. An APS workforce that incorporates broad perspectives and experiences can facilitate better service design and delivery.
Evidence from the private sector has shown that diverse and inclusive workplaces can improve organisational performance through better decisions and higher levels of innovation.[138] Demonstrating diversity is also one way of earning a social license to operate, and to build public trust in the APS.[139]
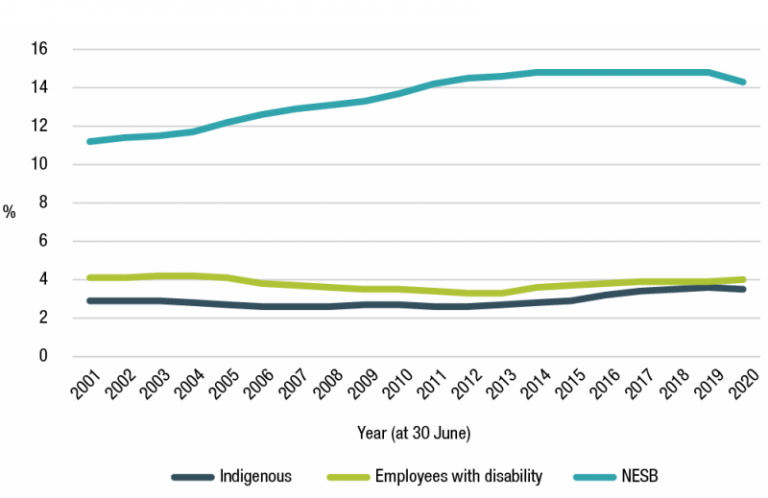
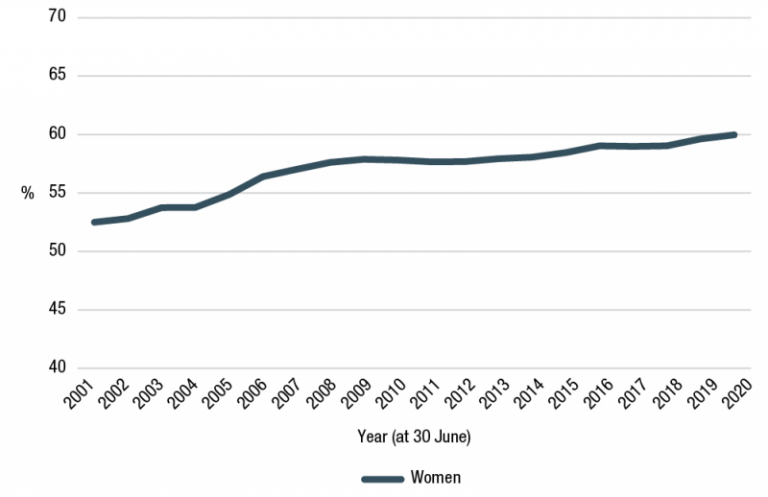
Long-term trends show increasing diversity in the APS, with greater proportions of women, Aboriginal and Torres Strait Islander employees, and those from a non-English speaking background. However, between 2001 and 2020, despite increasing numbers of employees with disability, there has been little change in the proportional representation within the workforce as whole.[140] Further, representation is about more than just raw percentages in the APS, it is about diversity among leadership cohorts, and across different types of roles and job families.
APSED data for the 12 months to 30 June 2020[141] shows:
- women occupy 60% of roles in the APS, following a long-term trend unfolding over the past 50 years
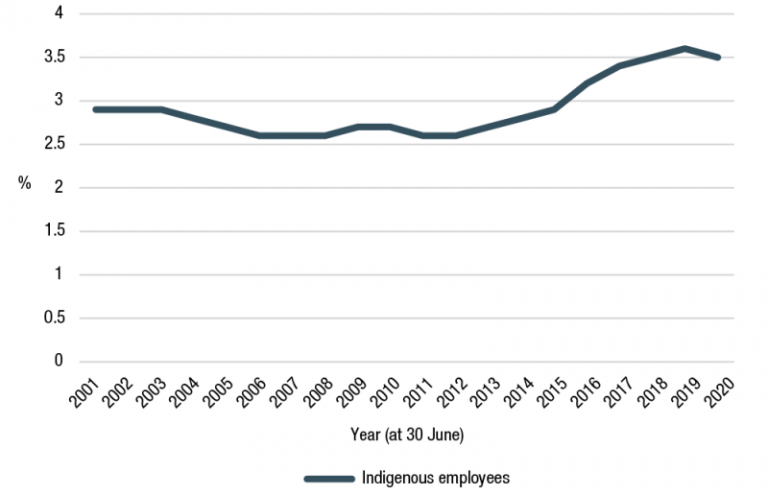
- a small drop in the representation of Aboriginal and Torres Strait Islander employees to 3.5%, despite long-term growth from 2.9% in 2001 to 3.6% in 2019
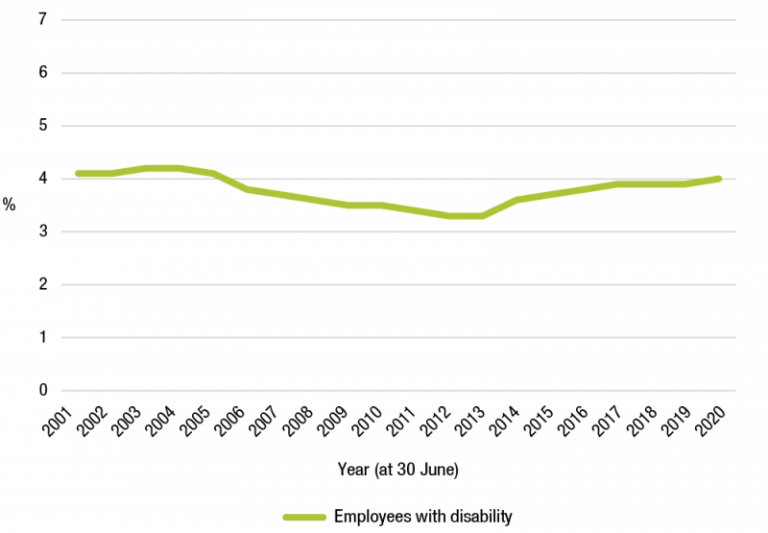
- a small increase in the representation of employees with disability to 4.0% (up from 3.9%), but stagnant over the long-term
- the number of employees from a non-English speaking background remained relatively stable.
Figure 3.4: Proportion of Aboriginal and Torres Strait Islander employees, employees with disability, and employees from a Non-English Speaking Background in the APS (2001 to 2020)
Source: APSED
Figure 3.5: Proportion of women in the APS (2001 to 2020)
Source: APSED
Fostering inclusion
‘Inclusion is much more than a ‘feel good’ exercise—it creates a better work environment which fuels performance.’
– Diversity Council of Australia[142]
A culture of inclusion is critical for the APS to achieve the benefits a diverse workforce can offer. It ensures APS work benefits from the perspectives and experiences that diversity brings. Inclusion also helps individuals feel valued, supported and respected. It allows their full potential to be realised at work as it minimises any sense they might need to hide or downplay aspects of their identity.[143]
Like its international counterparts, there is room for the APS to foster greater inclusion. A study of public sectors in OECD member countries shows that improvements are typically slow, pay gaps persist, representation at senior levels is lower for diverse cohorts, and employees report unacceptable levels of harassment and bullying.[144]
Representation of Aboriginal and Torres Strait Islander employees and employees with disability remain disproportionately low at senior levels, and data also shows low retention rates for these employees.
Increasing diversity and inclusion
Led by the Secretaries Board, the APS is addressing diversity and inclusion at a whole-of-service level through 4 action areas:
- Improving the employee experience for all Aboriginal and Torres Strait Islander employees across the Commonwealth and enhancing the capabilities of the Aboriginal and Torres Strait Islander workforce. The Commonwealth Aboriginal and Torres Strait Islander Workforce Strategy 2020-24 was launched in July 2020.
- Progressing gender equality across the APS through the APS Gender Equality Strategy refresh (underway).
- Recruiting and retaining more people with disability, and creating accessible and inclusive workplace cultures and environments for employees with disability, through the APS Disability Employment Strategy 2020-2025.
- Supporting mature aged workers who want to join and stay in the public service.
Aboriginal and Torres Strait Islander employees
‘People can't be what they can't see...the vast amount of lived experience of Indigenous Australians would be such a value asset to the public sector.’
– Letitia Hope, Deputy CEO, National Indigenous Australians Agency[145]
Aboriginal and Torres Strait Islander peoples and cultures make a unique contribution to Australia, and the APS. This is acknowledged in cultural awareness training and activities, language training, reconciliation action plans, and Indigenous champions embedded in many APS agencies.
Aboriginal and Torres Strait Islander leaders bring unique perspectives and new ways of working, with leadership styles characterised as team-based, consultative, drawing on emotional intelligence and uplifting others.[146]
The APS is focused on ensuring Aboriginal and Torres Strait Islander employees play a greater role in the work of the APS, through a renewed focus on cultural integrity and career development detailed in the Commonwealth Aboriginal and Torres Strait Islander Workforce Strategy 2020-24.
Indigenous Australians make up approximately 3.1% of the Australian working age population[147] and 3.5% of the APS.[148]
The proportion of Aboriginal and Torres Strait Islander employees in the APS has steadily increased over the past 20 years, from 2.9% to 3.5%—an increase of 21% since 2001 (Figure 3.6).
This is good progress, however overall representation dropped in the past 12 months (from 3.6% to 3.5%). Aboriginal and Torres Strait Islander employees remain employed in higher proportions at lower classifications and have comparatively high attrition rates.
Figure 3.6: Proportion of Aboriginal and Torres Strait Islander employees (2001 to 2020)
Source: APSED
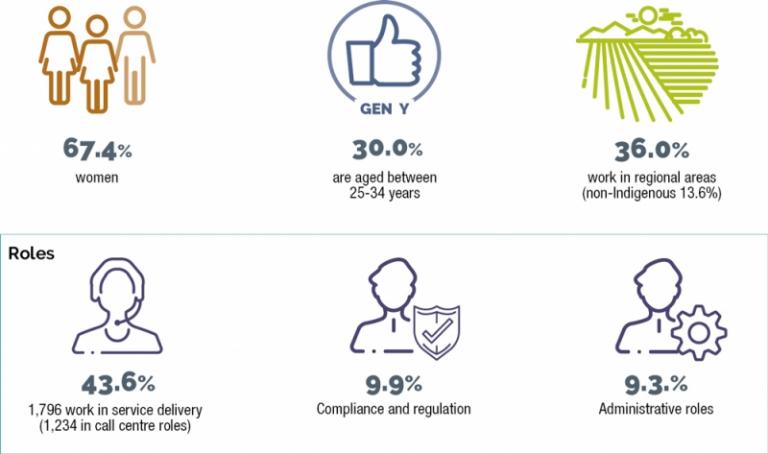
Aboriginal and Torres Strait Islander employees—at a glance.
Aboriginal and Torres Strait Islander Workforce Strategy 2020-24
The Commonwealth Aboriginal and Torres Strait Islander Workforce Strategy 2020-24 was launched on 1 July 2020 by the Minister for Indigenous Australians, the Hon Ken Wyatt AM MP.
The Strategy applies across the Commonwealth public sector, including the Australian Defence Force, the Australian Federal Police, and Australia Post.
The Strategy’s focus areas are:
- Cultural integrity: improving and embedding the understanding of Aboriginal and Torres Strait Islander culture in the workplace to enable culturally-safe workspaces and services, and creating a more inclusive Commonwealth public sector.
- Career pathways: diversifying and strengthening the pathways into and across the Commonwealth Public Sector.
- Career development and advancement: individual career development and advancement plans supported by targeted development initiatives and advancement opportunities.
Through the Strategy, all Commonwealth agencies have committed to build a talent pipeline through direct recruitment, professional development, and decreasing the relative separation rates of Aboriginal and Torres Strait Islander employees.
All Commonwealth agencies will be collectively accountable, with some taking the lead on solutions and sharing successes more broadly. The success of the strategy will rely on accountability and collaboration achieved through ongoing measurement and monitoring.
The Strategy will continue to be administered by the APSC and implemented in partnership with the National Indigenous Australians Agency and portfolio Commonwealth agencies.
Read more about the Commonwealth Aboriginal and Torres Strait Islander Workforce Strategy 2020-24 on the APSC website.
Recruitment and retention
APSED data shows that the APS struggles to retain Aboriginal and Torres Strait Islander employees. Annual engagement rates (as a proportion of all Aboriginal and Torres Strait Islander employees) are high, at around 13% on average over the past 2 decades (compared to 8% for non-Indigenous employees). However, Aboriginal and Torres Strait Islander employees stay in the service for a median 3.9 years as compared to 12.0 years for non-Indigenous employees. This is the largest difference in this metric over the last 20 years (Figure 3.10).
Most Aboriginal and Torres Strait Islander employees are recruited into lower classifications: trainee to APS 4 levels account for 79.4% of all Aboriginal and Torres Strait Islander employee engagements, compared to 50.7% of non-Indigenous employees.
The highest proportions of Aboriginal and Torres Strait Islander employees are employed at APS 4 (30.4%) and APS 3 (18.1%) levels (Figure 3.8). On 30 June 2020, just 39 members of the 2,805 SES identified as Aboriginal and Torres Strait Islander (1.4%).
There have been some shifts in the classifications of Indigenous employees over the past 20 years toward higher levels. There are now proportionally fewer Indigenous employees at the APS 1-2 classifications and more at the APS 5-6 and EL classifications. However, as was the case in 2001, almost half of Aboriginal and Torres Strait Islander employees in 2020 worked at the APS 3-4 classifications.
By comparison, the proportion of non-Indigenous employees in lower classifications has dropped across every level from APS 1 to APS 5. This is most marked at the APS 4 level where the proportion for non-Indigenous employees has dropped from 24.5% to 18.3% (Figures 3.7 and 3.8).
Figure 3.7: Proportion of Indigenous and non-Indigenous employment by APS classification (30 June 2001)
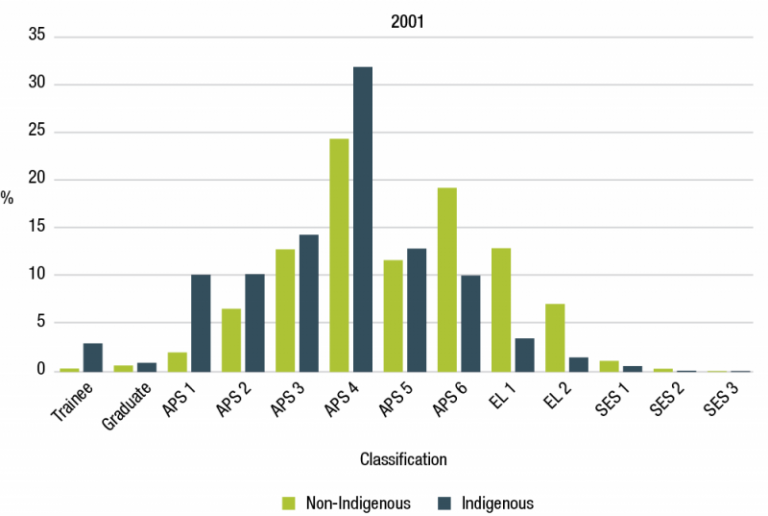
Source: APSED
Figure 3.8: Proportion of Indigenous and non-Indigenous employment by APS classification (30 June 2020)
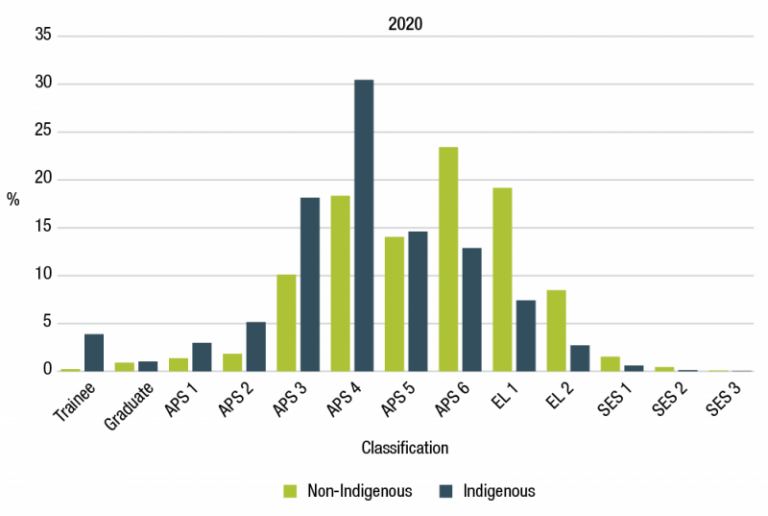
Source: APSED
APSED data shows low retention of Aboriginal and Torres Strait Islander employees. Of current ongoing Aboriginal and Torres Strait Islander employees 8.6% were recruited during 2019-20, compared with 6.6% of all non-Indigenous employees. Similarly, the separation rate is also higher for Indigenous employees: 9.1% left the APS within the past year compared to 5.9% of non-Indigenous employees.
Figure 3.9: Net engagement, Indigenous and non-Indigenous employees (2001 to 2020)
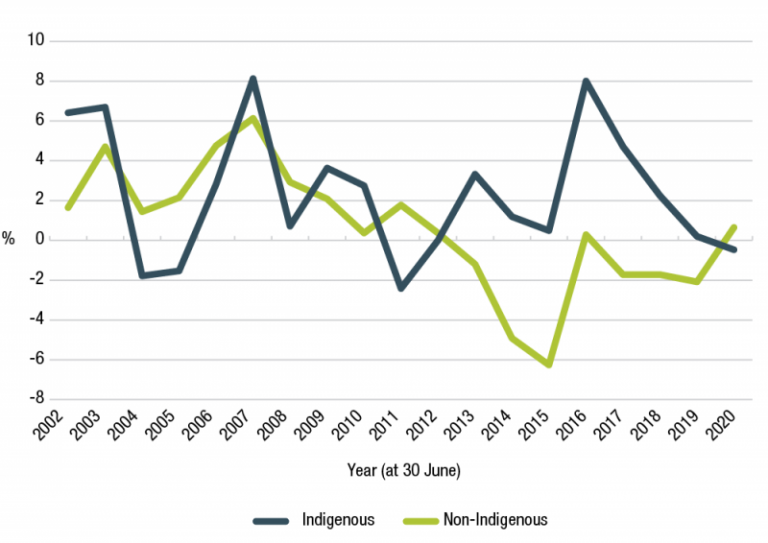
Source: APSED
Figure 3.10: Median length of service at separation, Indigenous and non-Indigenous employees (2000-01 to 2019‑20)
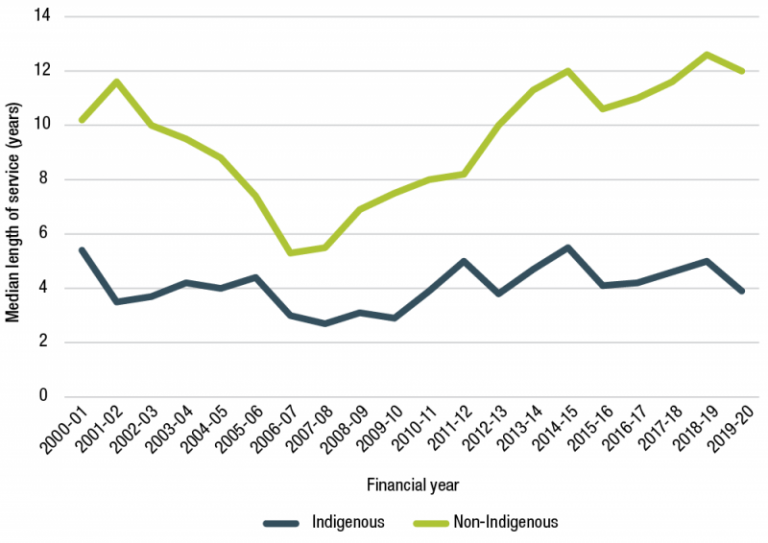
Source: APSED
Case study: Scholarship success
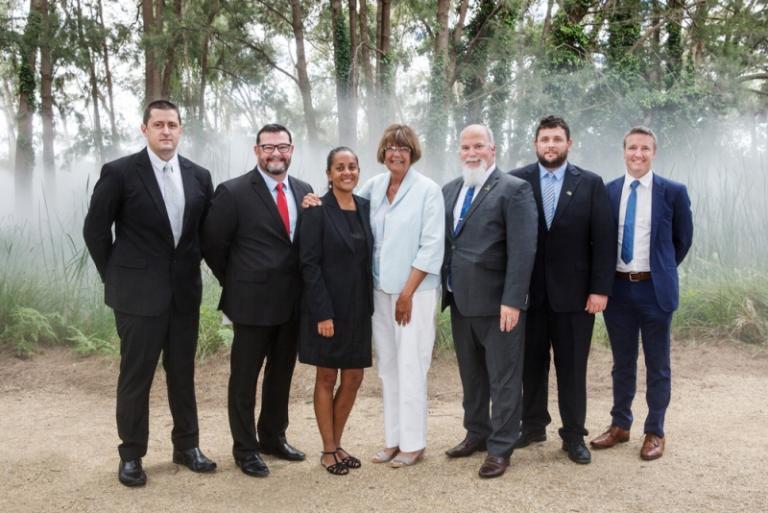
Caption: PJ Bligh (left) with Ms Pat Turner AM (centre) and the 2019 Sir Roland Wilson Pat Turner Scholars.
‘I want to be a senior leader in the APS. The Pat Turner scholarship is a great opportunity to develop Indigenous leaders and bring more knowledge to the APS.’
PJ Bligh was an inaugural Sir Roland Wilson Foundation Pat Turner scholar, and is the first to graduate from the program, completing a Graduate Diploma of Economics from the Australian National University.
PJ had previously studied marine science, but shifted his focus to economics due to its importance for the future of the APS. Returning to study was at times challenging, but PJ was excited to be able to take everything he learned through his studies to apply it in the workplace.
Following completion of his degree, PJ accepted a promotion at the Australian Institute of Aboriginal and Torres Strait Islander Studies.
‘I'm looking forward to going back into work and applying the lessons I have learned with new people and new challenges.’
PJ is also excited to give back as a scholarship alumni and hopes to use his study to improve outcomes for Aboriginal and Torres Strait Islander people.
The Sir Roland Wilson Foundation Pat Turner scholarship provides high performing Indigenous APS employees a full pay scholarship at either ANU or Charles Darwin University to undertake a postgraduate program.
Gender diversity
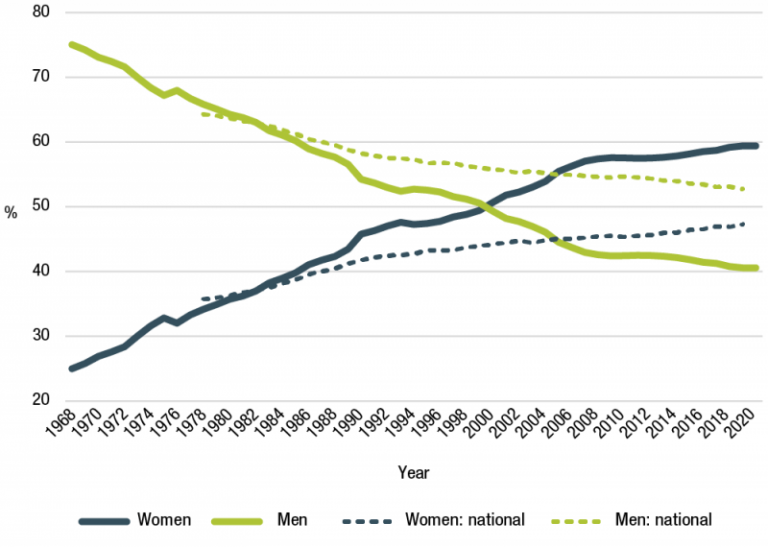
According to the 2019 OECD Government at a Glance, Australia performs above the OECD average in terms of gender equality in public sector employment.[149] In 1968, 2 years after the removal of the marriage bar (where women were forced to leave the APS when married), men dominated the APS. Just 1 in 4 employees were women. Today is almost the opposite (Figure 3.11). Proportionately there are now more women in the APS (60%) compared to their proportion in the Australian labour market (47%).[150] The APS has become an employer of choice for women, where women account for almost 3 in every 5 new ongoing recruits.
Figure 3.11: Proportion of women and men in the APS (ongoing), compared to Australian workforce participation rate (1968 to 2020)
Source: APSED
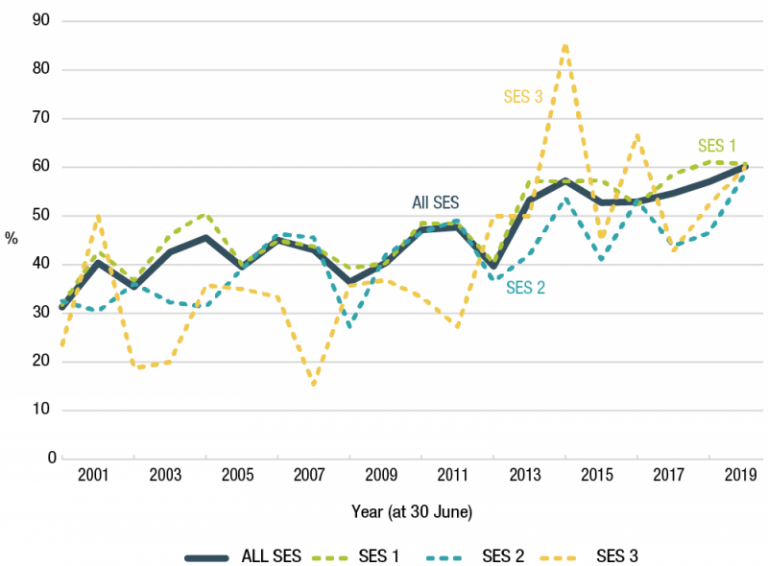
Women are well represented at all classification levels in the APS including the SES. The proportion of women in the SES is below 50%, however, this is changing quickly. For the past 6 years the proportion of promotions into and within the SES for women has exceeded 50%, on average (Figure 3.12).[151] In 2019-20 around 60% of promotions at SES 1 (60.7%), SES 2 (58.8%) and SES 3 (60.0%) were women.
Figure 3.12: Proportion of women promoted into and within the SES (2001 to 2020)
Source: APSED
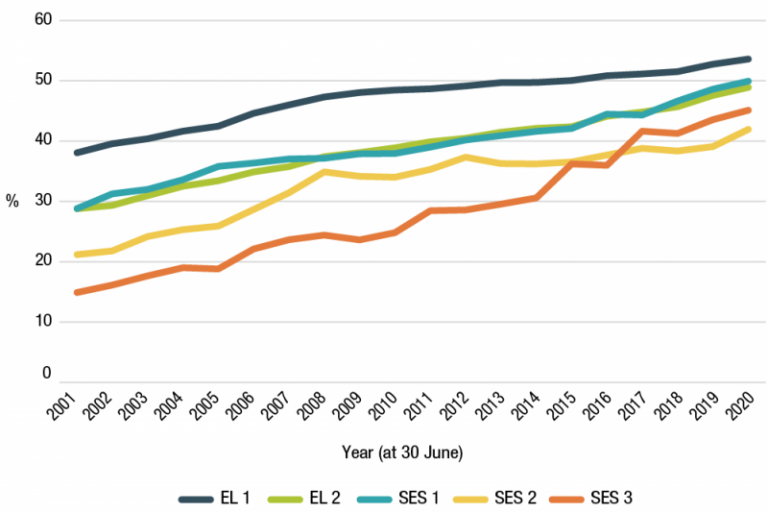
Figure 3.13: Proportion of women in leadership roles (EL 1 - SES 3) (2001 to 2020)
Source: APSED
In the APS women are more likely to be working part-time (21.7%) compared to men (5.0%). Both of these figures are significantly lower than their respective proportions in the broader Australian labour market, where 43% of women and 16% of men work part-time.[152]
In the APS 64.1% of non-ongoing roles are occupied by women. This is slightly higher than the proportion of women in ongoing roles (59.4%).
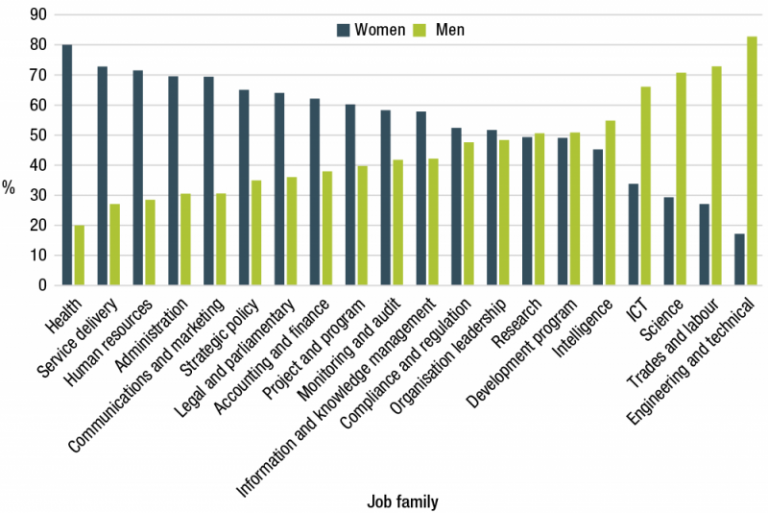
More women work in health (80.0%), service delivery (72.8%) and human resources (71.5%) roles, and more men work in engineering and technical (82.8%), trades and labour (72.9%) and science (70.7%) roles. (Figure 3.15)
Figure 3.14: Proportion of job family by gender (30 June 2020)
Source: APSED
Gender pay gap
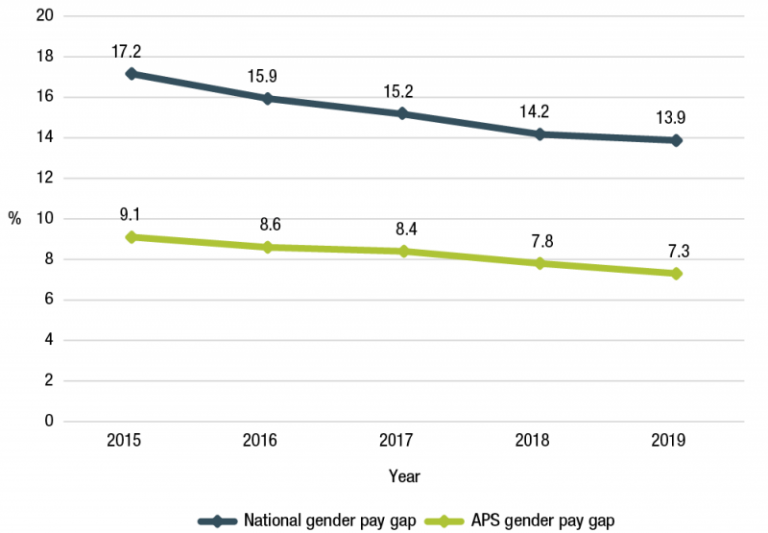
There is a gender pay gap of 7.3% in favour of men in the APS[153], however this has reduced from 9.1% in 2015.[154]
Based on 2019 APS average base salaries for men ($98,149) and women ($91,016), the gap in the APS is nearly half the national gender pay gap of 13.9% for the same time period (Figure 3.15). [155] However, it is higher than the gender pay gap for the Public Administration and Safety industry category (6.0%) which is the sector with the lowest pay gap. This demonstrates there is more to be done to reduce the gender pay gap in the APS.
Figure 3.15: Average APS gender pay gap trends, compared to national average (2015 to 2019)
Source: APS Remuneration Report 2019 and ABS
In the APS women are considered to be at pay parity for most classification levels with the differences in these classifications in the range of +/-1%. Graduate, APS 1, SES 2 and SES 3 classifications have slightly higher pay differences.
Better business outcomes
‘The case for greater gender equity is not just an issue of fairness and the ‘right thing to do’— it is supported by strong causal evidence that more women in leadership leads to better company performance, greater productivity and greater profitability.’[156]
Research shows that business outcomes improve when there is greater gender balance in leadership.
In the private sector, organisations with more women in senior leadership positions achieve better performance, productivity and profitability.[157] Gender diversity at the executive level has been associated with greater levels of inclusion, for example through the implementation of policies that are more supportive of LGBTIQ+ employees.[158] Research indicates women often bring leadership behaviours recognised as improving organisational performance, such as role-modelling and developing the capability of others.[159] It also shows that gender does not determine competency; women in leadership positions are equally competent as others.[160]
These successes are attributed to open, collegiate management approaches more often observed in women, including the ability to build consensus and inclusiveness by encouraging all voices at the table to be heard.[161]
These attributes apply to the public sector. APS departments with higher rates of women at the SES level are reported to give greater consideration to communication and networking skills, collaboration, collegiality and relationships.[162] Women leaders may also reduce barriers for others through a wider range of leadership styles and offering more opportunities for women to take on challenging or high-profile work.[163]
Sustained effort toward equal representation, as well as actions to promote and embed inclusive behaviours and cultures will ensure barriers to economic participation do not re-emerge, and continue to make gains where barriers remain, including for women who are members of other diversity cohorts, or due to the impacts of COVID-19.
Case study: Women in STEM at the Department of Defence
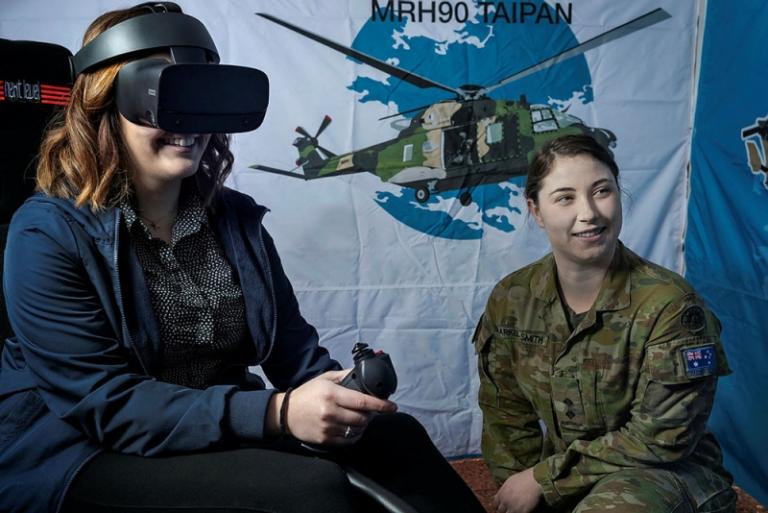
Caption: Australian Army officer Lieutenant Chloe Barker-Smith (right) mentors Defence Civilian Chloe Soklevski in the Fly Army virtual reality helicopter simulator experience in Canberra.
‘To enable us to meet the Defence and national security challenges of today and the future, it’s critical that we build a world-leading STEM-capable workforce. And we can only [do that] if we increase the depth and diversity of the talent pool. Increasing the participation rate of women is critical to achieving that.’ – Professor Tanya Monro, Chief Defence Scientist [164]
The Department of Defence has been working to progress gender equity in its workforce, with a strong focus on STEM skills. Women are underrepresented in STEM roles across the APS. Women make up 17.2% of engineering and technical roles, 33.9% of ICT roles and 29.3% of science roles across the APS.[165]
In February 2020, the Department of Defence partnered with the Australian Academy of Science to support the inaugural Catalysing Gender Equity 2020 conference. The event focused on tangible actions and initiatives that can bring about change, aiming to accelerate transformative and sustained change within the STEM sector to achieve true gender equality.
The Department of Defence has also signed up to be a champion of the Australian Academy of Science’s Women in STEM Decadal Plan, committing to support an industry-wide effort to drive gender equity in the STEM ecosystem.
The Department of Defence has been recognised for its commitment to advancing the careers of women, not only in STEM but across all groups and services, with the Department’s Science and Technology Group awarded the Athena Scientific Women’s Academic Network Institutional Bronze Award at the Science in Australia Gender Equity Awards. The proportion of women in Defence working in STEM roles has increased from 25.7% in 2016 to 29.8% in 2020.[166]
‘Addressing gender equity and diversity strengthens an organisation’s intellectual capital, and its capacity for problem-solving and innovation. This means better outcomes for people and business, and the long-term success of an organisation. It is not only the right thing for us to do in Defence—it is the smart thing for us to do. This award demonstrates the priority and value Defence places on gender and talent diversity in STEM disciplines.’ – Minister for Defence, Senator the Hon Linda Reynolds CSC [167]
APS Gender Equality Strategy
How might we…drive and embed inclusive workplace practices to enable all genders to fully participate so that the APS can deliver at its best?
The APS is committed to continue to improve the gender balance of its workforce through the APS Gender Equality Strategy. A refresh of the strategy is underway, drawing on an independent evaluation of Balancing the Future: the APS Gender Equality Strategy 2016-19.[168] The evaluation provided insights into implementation challenges, the need for better data, a sustained focus on culture change and leadership engagement, and flexibility in work practices. It concludes that the Strategy was a valuable tool to drive change but that ongoing efforts are required to embed positive changes, including lessons from the COVID-19 pandemic.
The refresh will be informed by broad consultation and APS-wide engagement, including in-depth interviews; virtual design hubs (in partnership with Services Australia) to consider practical, targeted solutions; and a deep-dive into the APSC data to look at the evidence base and check assumptions.
Led by the APSC in partnership with the Office for Women in PM&C and a cross-APS project team, it will analyse success factors and future focus areas to progress gender equality in the APS, and is due for implementation in 2021.
Diversity of gender and sexuality
When employees feel respected and valued they perform at their best. Research indicates that LGBTIQ+ employees have increased job satisfaction, a greater commitment to their work and improved health outcomes when employed by an organisation with LGBTIQ+ supportive workplace policies.[169]
In 2019, 4.8% of APS employee census respondents identified as LGBTIQ+, up from 4.1% in 2017.[170] As at 30 June 2020, 112 people identified in their HR systems as Gender X (indeterminate/intersex/unspecified). [171]
It is difficult to compare the proportion of APS employees who identify as LGBTIQ+ with the wider population of Australia, as studies rely on small sample sizes. Several sources estimate figures between 3% and 11%.[172]
In the 2019 APS employee census, employees who identified as LGBTIQ+ had similar levels of employee engagement, wellbeing, innovation, workplace inclusion, and job satisfaction compared to employees who did not. There was also little difference in results between LGBTIQ+ employees who are ‘out’ in the workplace and those who are not. However, employees who identified as LGBTIQ+ perceived discrimination, bullying and harassment in larger proportions than those who did not identify as LGBTIQ+.
Case study: ATOMIC: ATO Making Inclusion Count
‘We have an energised committee and membership that ensures every employee at the ATO feels they can bring their authentic whole self to work each day.’ – Christopher Healey, ATO Assistant Commissioner and SES Champion of the ATOMIC network
Launched in March 2016, the ATO’s LGBTIQ+ network, ATOMIC: ATO Making Inclusion Count has grown from 100 to 2,100 members in less than 5 years.
ATOMIC has identified innovative ways to support emerging LGBTIQ+ issues, including the establishment of the Gender Diverse Think Tank (GDTT). The GDTT has provided the opportunity to network, share experiences, and to identify and drive initiatives to improve policies such as the ATO’s Gender Transition Guide, and inclusion for ATO employees and clients.
In 2019, the ATO won a Gold Employer ranking at the Australian Workplace Equality Awards for the third year in a row. Gold Employer ranking is recognition of a substantial amount of work and activity in the area of LGBTIQ+ inclusion over the calendar year. ATOMIC’s success was recognised further with being awarded the Australian Human Resources Institute (AHRI) Michael Kirby Inclusion Award in 2019.
The challenges of COVID-19 has meant the ATOMIC network needed to rethink how to celebrate days of importance, educate staff on LGBTIQ+ topics, and maintain an active presence in the ATO in the absence of face-to-face events. Large scale events including International Day Against Homophobia, Biphobia, Intersexism and Transphobia, and Wear it Purple Day, were adapted for the ATO’s online collaboration platform and internal communications. Mental health services and support for network members during the pandemic were also promoted.
ATOMIC’s Co-Chairs Andrea Ross and Jan Lowe said:
‘We have been delighted and honoured to lead the ATOMIC network and work towards achieving our aims of creating an inclusive environment, promoting respectful, supportive and equitable culture for LGBTIQ+ employees and to provide forums for employees to support one another through sharing experiences and information.’
By connecting business objectives and the needs of employees, ATOMIC has driven cultural change across the ATO and the APS, delivering a sustainable LGBTIQ+ diversity program and an inclusive workplace environment, where all employees are valued and respected.
Disability
In Australia, the number of people living with disability is estimated to be about one-fifth of the population, and 2.1 million Australians of working age (15-64 years) have a disability.[173] The proportion of people with disability in the Australian labour force has not changed over the past 10 years,[174] comprising 8.8% of the total labour market in 2012.[175] However, those of working age are twice as likely to be unemployed compared to people without disabilities.[176]
The proportion of APS employees with disability reported in agency HR systems is 4%, roughly half that of the broader Australian labour market.[177] This figure may be underreported, with 8.4% of employees reporting as having a disability in the 2019 APS employee census.[178]
The proportion of APS employees with disability increased from a low of 3.3% in June 2013 (Figure 3.16). In the year to 30 June 2020 there was a small increase in employees with disability (323 employees) to 6,004 employees in total.[179]
Attraction and retention of more people with disability and the creation of accessible, inclusive workplaces are the focus of the forthcoming APS Disability Employment Strategy 2020-2025.
Figure 3.16: Proportion of employees with disability (2001 to 2020)
Source: APSED
Agencies that employ a high proportion of employees with disability at 30 June 2020 were the National Disability Insurance Agency (11.1%), the Australian Public Service Commission (8.6%), Safework Australia (7.4%), and the Department of Social Services (7.3%).
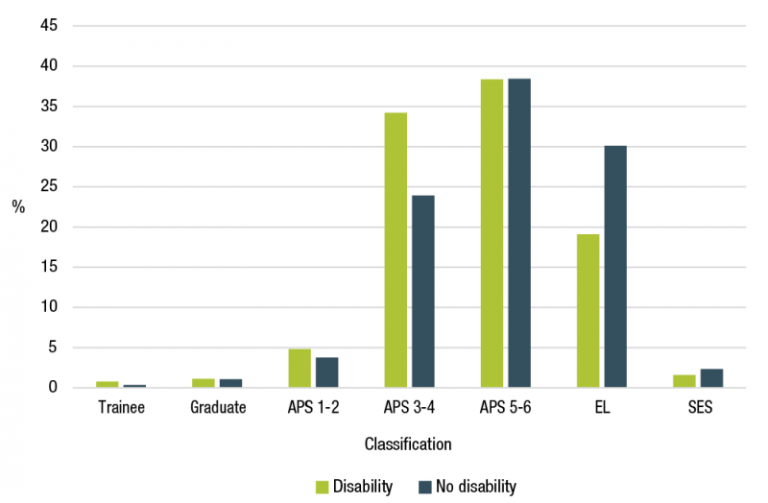
At 30 June 2020, the classification distribution of employees with disability largely mirrored that of employees without disability, with the exception of APS 3-4 and EL classifications (Figure 3.18). At the APS 3-4 classification, employees with disability were in greater relative proportion than employees without disability, while at the EL level the reverse is true. This difference may be explained by the high proportion of employees with disability working in service delivery where most roles are at the APS 3-4 classification.
Figure 3.17: Classification by disability status (30 June 2020)
Source: APSED
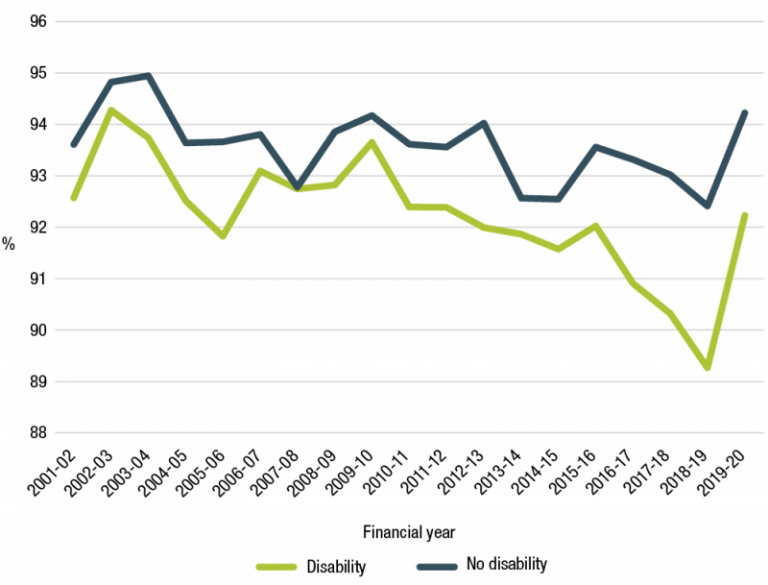
Over the last 20 years employees with disability have consistently had a lower retention rate than employees without disability (Figure 3.18).
Figure 3.18: Retention rate of employees with and without disability (2001-02 to 2019-20)
Source: APSED
The APS has higher rates of employees with disability (4.0%) than the Victorian Public Service (3.7%), Queensland public sector (2.8%) and Northern Territory Public Service (1.2%).
The need for ambitious employment targets for people with disability is also recognised across state and territory public sectors. For example, as part of their most recent Workforce Diversification and Inclusion Strategy, the Western Australian public sector has developed the People with Disability: Action Plan. The plan aims to increase the representation of people with disability from 1.5% where it has remained stagnant for some years, to the target of 5%.[180]
APS Disability Employment Strategy 2020-2025
In May 2019, the Australian Government committed to a new APS employment target for people with disability of 7% by 2025. This equates to employing at least an additional 5,000 people with disability.
The APSC partnered with the Department of Social Services to develop the APS Disability Employment Strategy 2020-2025.
A broad range of stakeholders across the public and private sector and those with lived experience of disability helped develop the Strategy.
The Strategy focuses on 2 areas, each with a number of key actions:
- attract, recruit and retain more people with disability
- create accessible and inclusive workplace cultures and environments.
The new Strategy will set an ambitious agenda for culture change. To meet the employment target, the APS will need to not only increase recruitment activity, but to create a more inclusive culture through accessible workplaces and a more flexible approach to job design. Actions will also encourage employees to share their disability status with their agencies so that, where appropriate, arrangements can be made to maximise their job satisfaction, engagement and productivity.
The Strategy’s successful implementation will require broad agency commitment and collaboration between senior leaders and APS employees to deliver real progress.
Case study: Coming full circle—from intern to host

‘I remember coming home after day one and I was thinking “this is it—I am a part of the Australian workforce!”’
In 2005 Deb Heron, currently an Assistant Director at the Disability Royal Commission, applied for the Stepping Into internship. Deb had previously applied for many internships, but was unsuccessful. She was concerned she was getting overlooked for opportunities due to her disability.
Hoping there were internships that catered to people with disability, Deb searched online for ‘internships disability’ and discovered the Australian Network on Disability’s Stepping Into program. She applied and expressed an interest in tax law, and a week later was contacted for an interview with the ATO. Although she was nervous at the beginning of the interview, she was put at ease when the interviewers did not comment or draw attention to her disability. This was a first for Deb.
One of the most important things Deb gained from her internship at the ATO was confidence. The ATO provided an inclusive workplace by asking Deb what support she might need to effectively fulfil her role. On her first day as a Stepping Into intern, Deb had a workplace assessment with a physiotherapist who suggested equipment to reduce the pain caused by her disability. This allowed her to work as productively as possible.
From the confidence, empowerment and growth of her capabilities, Deb’s career advanced to a second placement at the ATO, then into the ATO’s graduate program. Her career has since taken her to the Northern Territory Government, a change in career paths to Perth, work for the National Disability Insurance Scheme and to her current position at the Disability Royal Commission.
Now with a well-established career, Deb is once again participating in the Stepping Into program, but this time as host to an intern. Deb believes the Stepping Into program has opened many doors for her, and is seeking to give someone else the opportunities she had.
The Australian Government has a long history of hosting interns through the Stepping Into internship program. Since mid-2017, the APS has hosted 164 interns in 21 agencies. Many former Stepping Into interns continue on to permanent roles, and have long and successful careers in the APS.
See also: Winter Employability Series, the Australian Network on Disability.
Culturally and linguistically diverse
Culturally and linguistically diverse (CALD) groups describe those who were born overseas, have a parent born overseas or speak a variety of languages.[181]
Organisations with culturally and linguistically diverse workforces benefit from increased levels of cultural competency, innovation and creativity.[182] For the APS, bringing diverse perspectives and the potential for improved relationships with communities and stakeholders[183] will strengthen the government policies and services.
In the private sector, there are demonstrated financial benefits to supporting cultural diversity in the workplace. A study of more than 1,000 companies across 12 countries and multiple industries found that companies with the greatest proportion of CALD executives were 33% more likely to outperform other companies.[184] Research within the U.S. federal government workforce found greater cultural diversity was associated with higher organisational performance.[185]
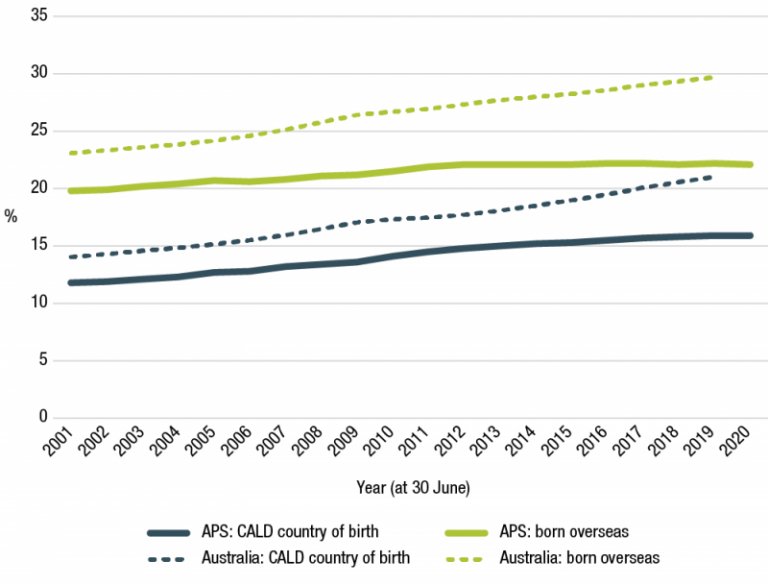
In Australia in 2019, 29.7% of Australians were born overseas and 21.4% were from a CALD country.[186] At 30 June 2020, 22.1% of APS employees were born overseas with 15.9% from non-English speaking countries. Since 2000, there has been an increase in the proportion of APS employees born overseas, especially those coming from non‑English speaking countries (Figure 3.19).
Figure 3.19: Proportion of culturally and linguistically diverse employees, APS and Australia (2001 to 2020)
Source: APSED[187]
While long-term trends mirror the Australian population, the proportion of APS employees born overseas is consistently lower than that of the Australian population. In recent years, employment of CALD employees in the APS has been slowing.
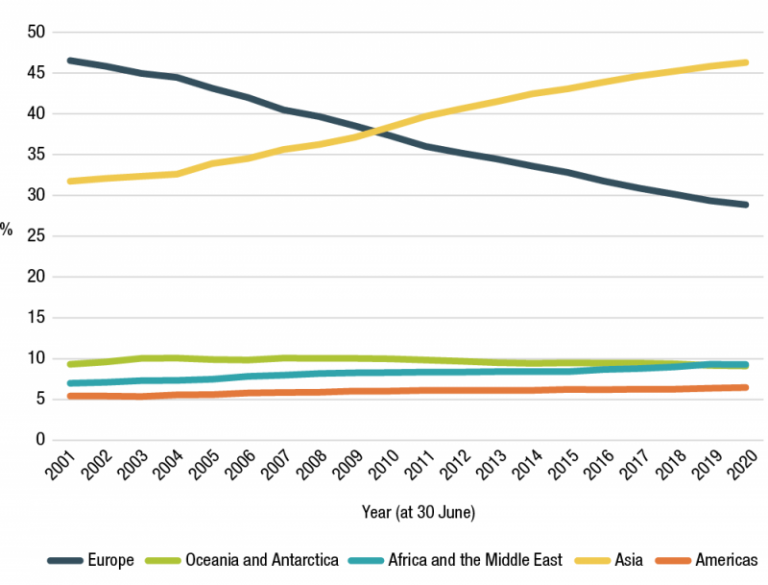
In 2010 the number of APS employees born in Asia outnumbered those born in Europe for the first time. This year, of those born overseas, most employees were born in either Asia (46.3%) or Europe (28.8%) (Figure 3.20).
Other regions make up less than 10% each and have only changed marginally over the last 2 decades. Compared to the Australian population, the proportion of APS employees born in Asia is relatively higher while all other regions have a slightly lower representation.
Figure 3.20: Region of birth for APS employees born overseas (2001 to 2020)
Source: APSED
Multi-generational
The make-up of Australia’s population is changing. The population is ageing[188] and the APS workforce is becoming more age-diverse. There are a number of benefits of an age-diverse workforce, including a stronger pipeline of talent, employee engagement, performance, and workforce stability.
The average age of APS employees was 43.5 years at 30 June 2020, increasing steadily from 40 years in 2001. This is in line with the trends in ageing across the general Australian workforce.
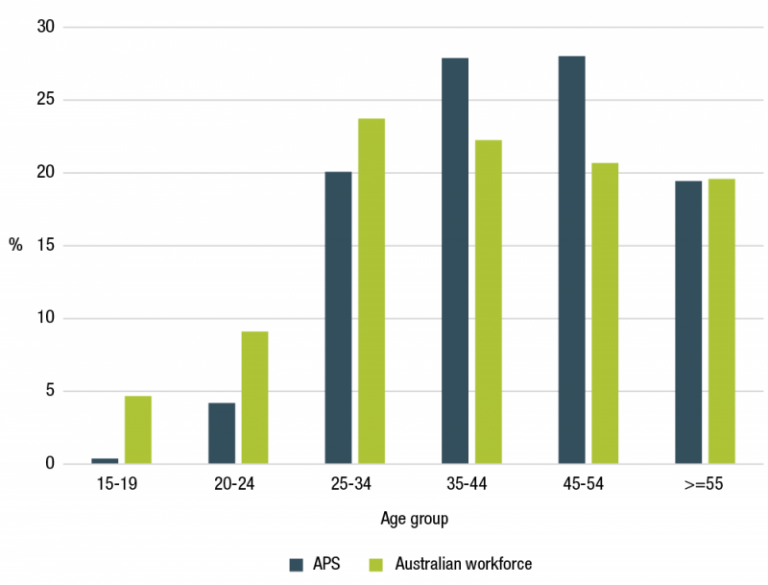
The proportion of the APS population that is 50 years or older has increased from 20.2% in 2001 to 32.8% in 2020. At 30 June 2020, 8.3% of APS employees were aged 60 years and over. The number of employees under the age of 30 has declined from 18.2% in 2001 to 13.3% in 2020.
Figure 3.21: Age distribution comparison between APS and Australian workforce (30 June 2020)
Source: APSED
As the proportion of Australians aged 65 years and over continues to increase, from 15% in 2017 to a projected 22% in 2066[189], participation rates for this cohort are expected to increase within the APS.
Age of retirement
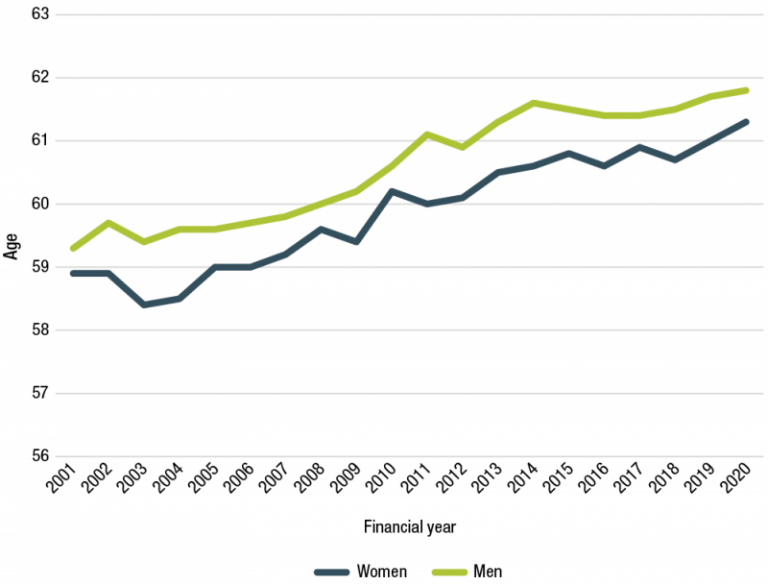
The APS does not have a maximum retirement age; employees choose when to retire. The average retirement age within the APS has been increasing over time, from 59.1 years of age in 2000-01, to 61.5 in 2019‑20. This remains lower than the national average age of 65.5 years in 2018-19 for people who were intending to retire.[190]
The rise in average retirement age of APS employees may well be linked with the phasing out of the Commonwealth Superannuation Scheme (CSS) and the Public Sector Superannuation Scheme (PSS).[191] From 2015 to 2019 the proportion of employees with a CSS scheme declined from 3.6% to 1.5%, and the proportion with a PSS scheme declined from 46.4% to 36.8%.
Figure 3.22: APS average retirement age by gender (2001 to 2020)
Source: APSED
Impact of COVID-19 on employees from diverse groups
It has been widely recognised that the COVID-19 pandemic has had a disproportionate impact on vulnerable people, including people from diverse groups.[192] This is a global issue, and is not unique to the APS or Australia.
Many individual employees are also more vulnerable to the health impacts of COVID-19. Groups that are at greater risk of more serious illness if they contract COVID-19 include Aboriginal and Torres Strait Islander people, older people, people with chronic health conditions, and people with disability.[193]
During May 2020, 76% of Australians with children in their household kept them home from school or childcare due to the pandemic. In this period, Australian women were almost 3 times as likely as men to look after children full-time on their own (46% compared with 17%).[194] While there is no APS COVID-19 related childcare data available, of the 41% of APS employee census respondents in 2019 who reported having caring responsibilities (including care of children), 63% were women and 32% men.[195]
The COVID-19 pandemic has also had significant mental health impacts on Australians. People with pre-existing mental health problems are at increased risk of experiencing significant anxiety and distress during a disease outbreak.[196] Mental health support and national crisis services such as Lifeline and Beyond Blue have seen a surge in demand during the pandemic. Internal APS agency employee survey results conducted during the pandemic indicate mixed outcomes for the mental wellbeing of APS employees which will continue to be monitored closely.
Despite the many challenges faced, changed ways of working have had positive impacts for some APS employees from diverse groups.
Anecdotally, increased flexibility and working from home arrangements have been beneficial for some employees with disability. For example, some neurodiverse employees have reported increased job satisfaction while working from home as compared to working in an office, as they have been able to control and adjust environmental factors such as noise and light.[197]
Through COVID-19, APS managers and leaders report they have learned a great deal about the unique needs of their colleagues and teams.[198] More than ever, the APS remains committed to an inclusive culture, with a strong focus on wellbeing and flexibility that supports the needs of all employees.
[137] Commonwealth of Australia. (2019). Delivering for Australians: A world-class Australian Public Service. The Government’s APS reform agenda
[138] McKinsey & Company. (2020). Diversity wins: How inclusion matters
[139] OECD. (2019). Next generation diversity and inclusion policies in the public service
[140] As reported in agency HR systems. There is suspected under-reporting as 8.4% of employees report living with disability in the 2019 APS employee census.
[141] Through APSED the APS collects self-reported data on gender diversity and the representation of Aboriginal and Torres Strait Islander employees, employees with disability, and those from non-English speaking backgrounds (Appendix 1). Some APS employees choose not to provide this information so the diversity data in this chapter is indicative only. Diversity is also broader than the APS centrally collects and may, for example, relate to educational background and experience in non-APS sectors.
[142] Diversity Council of Australia. (2020). Business Case for Inclusion
[143] Deloitte. (2013). Uncovering talent: A new model of inclusion
[144]] OECD. (2019). Next generation diversity and inclusion policies in the public service
[145] The Sydney Morning Herald. (2020). New plan boosts Indigenous Australians in senior public sector roles. 2 July.
[146] Savage. (2017). Indigenous Affairs: finding a way forward for community and public servants. Address to ‘Indigenous Affairs and Public Administration: Can’t we do better?’ conference, 9-10 October 2017, Sydney.
[147] ABS. (2020). National, state and territory population, March 2020; ABS. (2020). Estimates and Projections, Aboriginal and Torres Strait Islander Australians, 2006 to 2031
[148] APSED
[149] OECD. (2019). Government at a Glance
[150] WGEA. (2020). Gender workplace statistics at a glance 2020
[151] Promotions, as opposed to new hires, account for around 70% of new SES employees.
[152] ABS. (2019). Gender Indicators, Australia. 1 November.
[153] Expressed as a percentage of male earnings, the gender pay gap is the difference between men and women employees’ average base salaries. APSC. (2020). Remuneration reports
[154] The APS calculation is based on the methodology used by the Australian Bureau of Statistics and the Workplace Gender Equality Agency (WGEA). Using this methodology allows for the APS gender pay gap to be compared to other benchmarks such as the National Gender Pay Gap and the broader public sector (inclusive of states and territories). Australian Public Service Remuneration Report 2019
[155] As calculated by WGEA using seasonally adjusted average weekly earnings data from the ABS. Australia's Gender Pay Gap Statistics 2020
[156] Cassells & Duncan. (2020). Gender Equity Insights 2020: Delivering the Business Outcomes
[157] Ibid.; McKinsey & Company. (2020). Diversity wins: How inclusion matters
[158] Fine, C., Sojo, V., & Lawford‐Smith, H. (2020). Why does workplace gender diversity matter? Justice, organizational benefits, and policy. Social Issues and Policy Review, 14(1), pp.36-72.
[189] McKinsey & Company. 2008. Women Matter 2: Female leadership, a competitive edge for the future
[160] Ross (2008) and Caliper (2014) in Morris. (2016). Women’s Leadership Matters: The impact of women’s leadership in the Canadian federal public service
[161] Zenger and Folkman. (2019). Research: Women Score Higher Than Men in Most Leadership Skills
[162] Meredith Edwards, Bill Burmester, Mark Evans, Max Halupka and Deborah May (2013). Not yet 50/50: Barriers to the Progress of Senior Women in the Australian Public Service
[163] Ibid.
[164] Department of Defence. (2020). Defence Affirms Commitment to Gender Equity
[165] APSED
[166] Ibid
[167] Senator the Hon Linda Reynolds CSC. (2020). Defence commitment to gender equity in STEM recognised
[168] Australian Government. (2016). Balancing the Future: the APS Gender Equality Strategy 2016-19
[169] Badgett, M.V.L., Durso, L.E., Kastanis, A. & Mallory, C. (2013). The business impact of LGBT-supportive workplace policies
[170] Due to the change in timeframes of the 2020 APS employee census, the most recent data on representation of APS employees who identify as LGBTIQ+ is from the 2019 APS employee census.
[171] APSED
[172]Most studies into the populations of LGBTIQ+ people focus on smaller subgroups, such as estimating the proportion of the population that is lesbian, or homosexual, or bisexual, rather than the entire LGBTIQ+ population as a cohort. It’s difficult to compare these results with the APS results since individuals may identify with more than one subgroup of the LGBTIQ+ population, or with subgroups that are not investigated by these studies.
[173] Australian Network on Disability. (2019). Disability statistics
[174] ABS. (2020). Disability, Ageing and Carers, Australia: Summary of Findings, 2018
[175] ABS. (2015). Disability and Labour Force Participation, 2012
[176] Australian Institute of Health and Welfare. (2019). People with disability in Australia: in brief
[177]The definition of ‘disability’ used in the APS is based on the Australian Bureau of Statistics’ Survey of Disability, Ageing and Carers. More information is available at: APSC. (2019). Definition of disability
[178] Under-reporting may be due to an unwillingness to disclose in departmental systems (responses to the APS employee census are de-identified) or disability acquired since an employee’s time of recruitment may not be updated in systems.
[179] APSED
[180] WA Government. (2020). People with Disability: Action Plan to Improve WA Public Sector Employment Outcomes 2020-2025
[181] Country of birth, first language spoken, mother’s and father’s first language, language spoken at home and year of arrival in Australia data elements are collected in the APSED. The ABS defines the CALD population mainly by country of birth, language spoken at home, self-reported English proficiency, or other characteristics including year of arrival in Australia, parents' country of birth and religious affiliation. The APSC is currently reviewing its data collection to move towards metrics that more closely align with the CALD metrics used by the ABS. ABS Standard for Statistics on Cultural and Language Diversity (ABS cat. No. 1289.0) 1999
[182] SGS Economics & Planning. (2017). Planning in Australia: economic benefits of cultural diversity
[183] Federation of Ethnic Communities’ Councils of Australia. (2013). Harmony in the workplace: Delivering the diversity dividend: Maximising the value of cultural diversity
[184] Hunt, V., Prince, S., Dixon-Fyle, S. & Yee, L. (2018). Delivering through diversity
[185] Moon, K. K., & Christensen, R. K. (2020). Realizing the performance benefits of workforce diversity in the US Federal Government: The moderating role of diversity climate. Public Personnel Management, 49(1), pp. 141-165.
[186] ABS. (2020). Migration, Australia 2018-19
[187] A CALD country is defined as a country that is not in the list of Main English-Speaking Countries as described by the ABS.
[188] ABS. (2018). Population Projections, Australia, 2017 (base) – 2066
[189] Ibid.
[190] ABS. (2020). Retirement and Retirement Intentions, Australia, 2018-19
[191] APSC. (2020). Remuneration Report 2019: Chapter 4: Total Remuneration Package
[192] KPMG. (2020). The global coronavirus pandemic is exacerbating existing vulnerabilities and creating new ones. 7 May.
[193] Department of Health. (2020). Advice for people at risk of coronavirus (COVID-19)
[194] ABS. (2020). 4940.0 – Household Impacts of COVID-19 Survey, 12-15 May 2020
[195] 2019 APS employee census
[196] Black Dog Institute. (2020). Mental Health Ramifications of COVID-19: The Australian context
[197] Insights from conversations with APS employees
[198] COO interviews [unpublished]


