Working away from the office
In 2024, the Australian Public Service Employee Census included the question ‘Do you currently access any of the following flexible working arrangements?’
Respondents who indicated they accessed working away from the office/working from home were asked the supplementary question ‘During your usual working week, how often do you work away from the office/work from home?’
Data from these questions provides information about the proportions of employees who engage in ‘Working away from the office’.
Figures AB 46 to AB 51 and tables AB 46 to AB 51 report on the proportions of employees who engage in ‘Working away from the office’ for agencies, by agency size, for APS respondents.
Respondents had 5 options to choose from for this question. Figures AB 46 to AB 51 show 4 of the options, excluding ‘Did not disclose their arrangement’. The proportions for this category were mostly below half a percentage point, and are included in tables AB 46 to 51.
Note: Only results for APS agencies are presented. APS Employee Census results for entities that engage staff under the Public Service Act 1999 but are not APS agencies under the Act are available on the entity’s website.
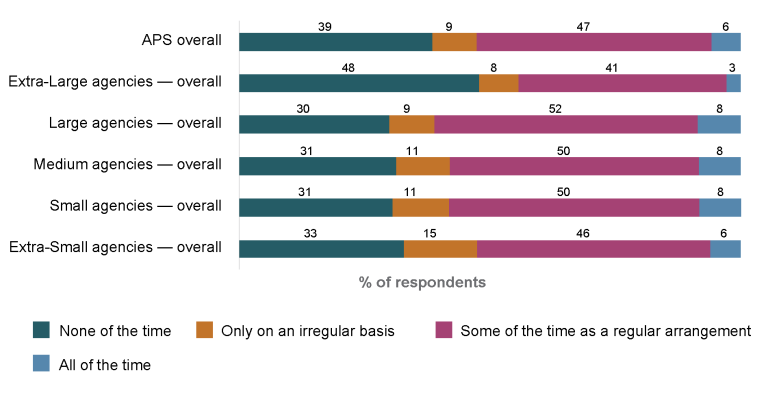
Figure AB 46: Percentage of employees working away from the office, by agency size
Source: APS Employee Census
Table AB 46: Percentage of employees working away from the office, by agency size
| Agency | % of respondents working away from the office | ||||
|---|---|---|---|---|---|
| None of the time | Only on an irregular basis | Some of the time as a regular arrangement | All of the time | Did not disclose their arrangement | |
| Overall APS | 39 | 9 | 47 | 6 | < 0.5 |
| Extra-large (10,000+ employees) | 48 | 8 | 41 | 3 | < 0.5 |
| Large (1,001 to 10,000 employees) | 30 | 9 | 52 | 8 | < 0.5 |
| Medium (251 to 1,000 employees) | 31 | 11 | 50 | 8 | < 0.5 |
| Small (101 to 250 employees) | 31 | 11 | 50 | 8 | < 0.5 |
| Extra-small (20 to 100 employees) | 33 | 15 | 46 | 6 | < 0.5 |
Source: APS Employee Census
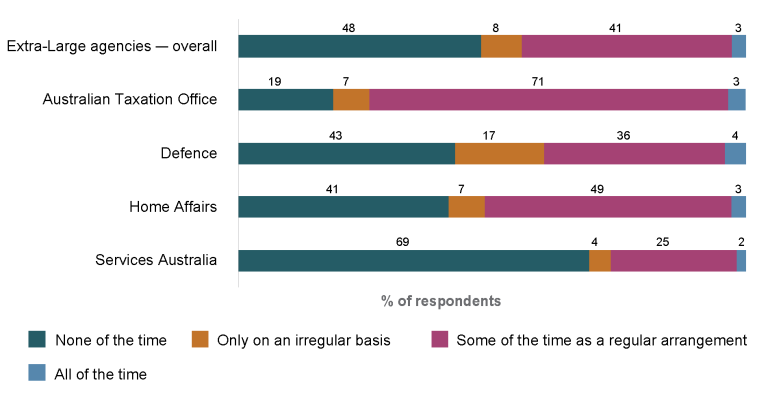
Figure AB 47: Extra-large agencies percentage of employees working away from the office (10,000+ employees)
Source: APS Employee Census
Table AB 47: Extra-large agencies percentage of employees working away from the office (10,000+ employees)
| Agency | % of respondents working away from the office | ||||
|---|---|---|---|---|---|
| None of the time | Only on an irregular basis | Some of the time as a regular arrangement | All of the time | Did not disclose their arrangement | |
| Extra-large agencies – overall | 48 | 8 | 41 | 3 | < 0.5 |
| Australian Taxation Office | 19 | 7 | 71 | 3 | < 0.5 |
| Defence | 43 | 17 | 36 | 4 | < 0.5 |
| Home Affairs | 41 | 7 | 49 | 3 | < 0.5 |
| Services Australia | 69 | 4 | 25 | 2 | < 0.5 |
Source: APS Employee Census
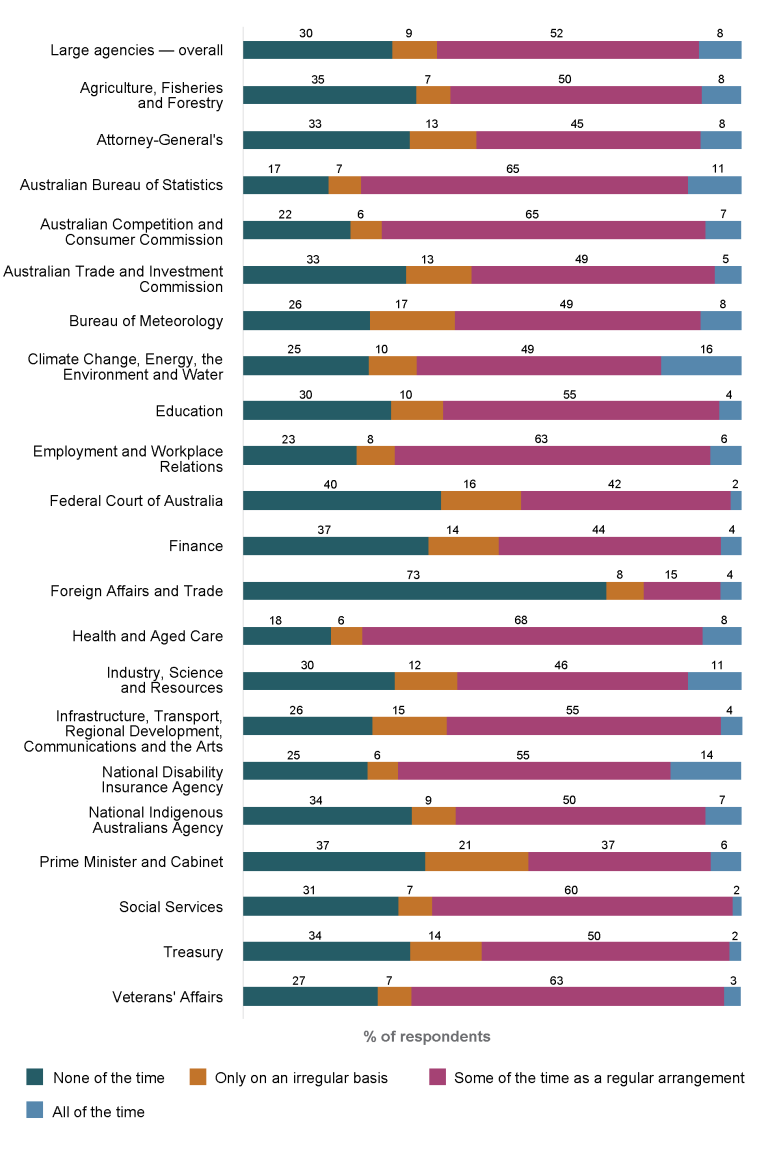
Figure AB 48: Large agencies percentage of employees working away from the office (1,001 to 10,000 employees)
Source: APS Employee Census
Table AB 48: Large agencies percentage of employees working away from the office (1,001 to 10,000 employees)
| Agency | % of respondents working away from the office | ||||
|---|---|---|---|---|---|
| None of the time | Only on an irregular basis | Some of the time as a regular arrangement | All of the time | Did not disclose their arrangement | |
| Large agencies – overall | 30 | 9 | 52 | 8 | < 0.5 |
| Agriculture, Fisheries and Forestry | 35 | 7 | 50 | 8 | < 0.5 |
| Attorney-General's | 33 | 13 | 45 | 8 | < 0.5 |
| Australian Bureau of Statistics | 17 | 7 | 65 | 11 | < 0.5 |
| Australian Competition and Consumer Commission | 22 | 6 | 65 | 7 | < 0.5 |
| Australian Trade and Investment Commission | 33 | 13 | 49 | 5 | < 0.5 |
| Bureau of Meteorology | 26 | 17 | 49 | 8 | < 0.5 |
| Climate Change, Energy, the Environment and Water | 25 | 10 | 49 | 16 | < 0.5 |
| Education | 30 | 10 | 55 | 4 | < 0.5 |
| Employment and Workplace Relations | 23 | 8 | 63 | 6 | < 0.5 |
| Federal Court of Australia | 40 | 16 | 42 | 2 | < 0.5 |
| Finance | 37 | 14 | 44 | 4 | < 0.5 |
| Foreign Affairs and Trade | 73 | 8 | 15 | 4 | < 0.5 |
| Health and Aged Care | 18 | 6 | 68 | 8 | < 0.5 |
| Industry, Science and Resources | 30 | 12 | 46 | 11 | < 0.5 |
| Infrastructure, Transport, Regional Development, Communications and the Arts | 26 | 15 | 55 | 4 | < 0.5 |
| National Disability Insurance Agency | 25 | 6 | 55 | 14 | < 0.5 |
| National Indigenous Australians Agency | 34 | 9 | 50 | 7 | < 0.5 |
| Prime Minister and Cabinet | 37 | 21 | 37 | 6 | < 0.5 |
| Social Services | 31 | 7 | 60 | 2 | < 0.5 |
| Treasury | 34 | 14 | 50 | 2 | < 0.5 |
| Veterans' Affairs | 27 | 7 | 63 | 3 | < 0.5 |
Source: APS Employee Census
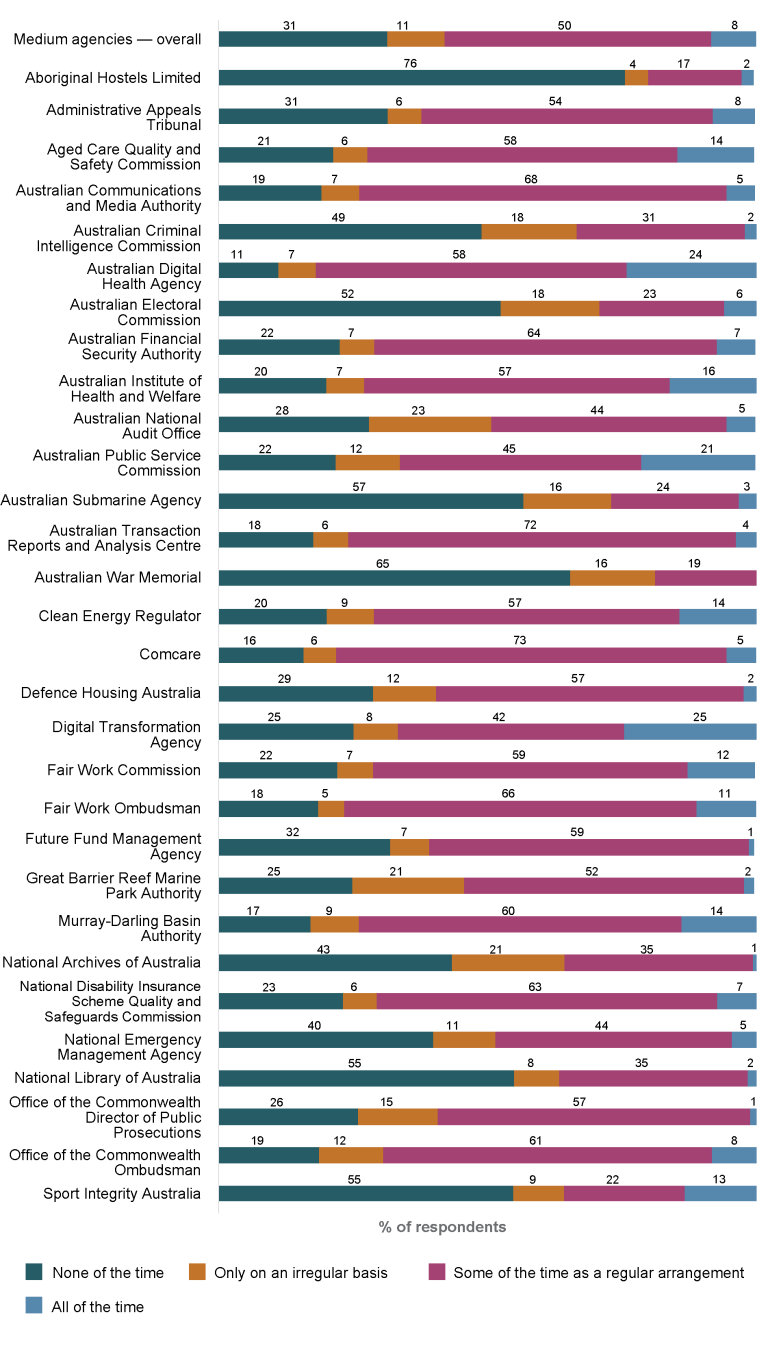
Figure AB 49: Medium agencies percentage of employees working away from the office (251 to 1,000 employees)
Source: APS Employee Census
Table AB 49: Medium agencies percentage of employees working away from the office (251 to 1,000 employees)
| Agency | % of respondents working away from the office | ||||
|---|---|---|---|---|---|
| None of the time | Only on an irregular basis | Some of the time as a regular arrangement | All of the time | Did not disclose their arrangement | |
| Medium agencies – overall | 31 | 11 | 50 | 8 | < 0.5 |
| Aboriginal Hostels Limited | 76 | 4 | 17 | 2 | 1 |
| Administrative Appeals Tribunal | 31 | 6 | 54 | 8 | < 0.5 |
| Aged Care Quality and Safety Commission | 21 | 6 | 58 | 14 | < 0.5 |
| Australian Communications and Media Authority | 19 | 7 | 68 | 5 | < 0.5 |
| Australian Criminal Intelligence Commission | 49 | 18 | 31 | 2 | 0 |
| Australian Digital Health Agency | 11 | 7 | 58 | 24 | 0 |
| Australian Electoral Commission | 52 | 18 | 23 | 6 | 0 |
| Australian Financial Security Authority | 22 | 7 | 64 | 7 | < 0.5 |
| Australian Institute of Health and Welfare | 20 | 7 | 57 | 16 | 0 |
| Australian National Audit Office | 28 | 23 | 44 | 5 | < 0.5 |
| Australian Public Service Commission | 22 | 12 | 45 | 21 | < 0.5 |
| Australian Submarine Agency | 57 | 16 | 24 | 3 | 0 |
| Australian Transaction Reports and Analysis Centre | 18 | 6 | 72 | 4 | 0 |
| Australian War Memorial | 65 | 16 | 19 | 0 | 0 |
| Clean Energy Regulator | 20 | 9 | 57 | 14 | 0 |
| Comcare | 16 | 6 | 73 | 5 | < 0.5 |
| Defence Housing Australia | 29 | 12 | 57 | 2 | 0 |
| Digital Transformation Agency | 25 | 8 | 42 | 25 | 0 |
| Fair Work Commission | 22 | 7 | 59 | 12 | < 0.5 |
| Fair Work Ombudsman | 18 | 5 | 66 | 11 | < 0.5 |
| Future Fund Management Agency | 32 | 7 | 59 | 1 | < 0.5 |
| Great Barrier Reef Marine Park Authority | 25 | 21 | 52 | 2 | < 0.5 |
| Murray-Darling Basin Authority | 17 | 9 | 60 | 14 | 0 |
| National Archives of Australia | 43 | 21 | 35 | 1 | 0 |
| National Disability Insurance Scheme Quality and Safeguards Commission | 23 | 6 | 63 | 7 | 0 |
| National Emergency Management Agency | 40 | 11 | 44 | 5 | 0 |
| National Library of Australia | 55 | 8 | 35 | 2 | 0 |
| Office of the Commonwealth Director of Public Prosecutions | 26 | 15 | 57 | 1 | 1 |
| Office of the Commonwealth Ombudsman | 19 | 12 | 61 | 8 | < 0.5 |
| Sport Integrity Australia | 55 | 9 | 22 | 13 | 0 |
Source: APS Employee Census
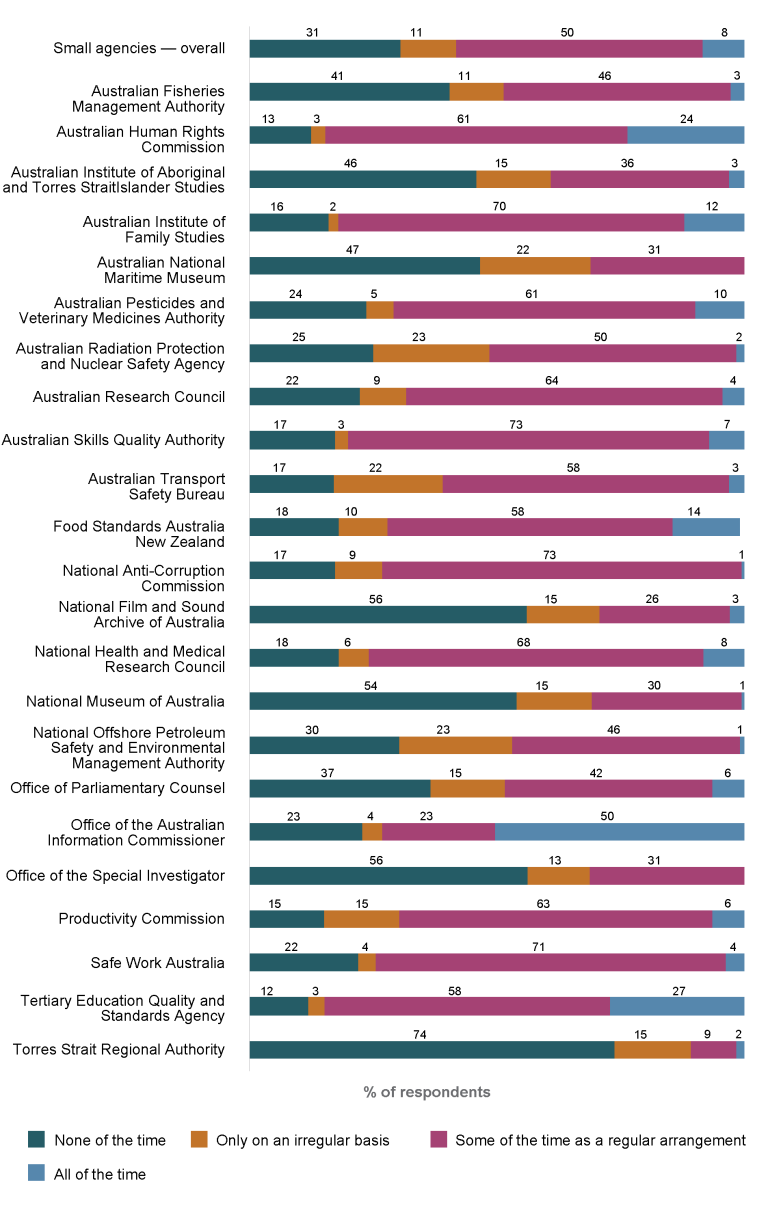
Figure AB 50: Small agencies percentage of employees working away from the office (101 to 250 employees)
Source: APS Employee Census
Table AB 50: Small agencies percentage of employees working away from the office (101 to 250 employees)
| Agency | % of respondents working away from the office | ||||
|---|---|---|---|---|---|
| None of the time | Only on an irregular basis | Some of the time as a regular arrangement | All of the time | Did not disclose their arrangement | |
| Small agencies – overall | 31 | 11 | 50 | 8 | < 0.5 |
| Australian Fisheries Management Authority | 41 | 11 | 46 | 3 | 0 |
| Australian Human Rights Commission | 13 | 3 | 61 | 24 | 0 |
| Australian Institute of Aboriginal and Torres Strait Islander Studies | 46 | 15 | 36 | 3 | 0 |
| Australian Institute of Family Studies | 16 | 2 | 70 | 12 | 0 |
| Australian National Maritime Museum | 47 | 22 | 31 | 0 | 0 |
| Australian Pesticides and Veterinary Medicines Authority | 24 | 5 | 61 | 10 | 0 |
| Australian Radiation Protection and Nuclear Safety Agency | 25 | 23 | 50 | 2 | 0 |
| Australian Research Council | 22 | 9 | 64 | 4 | 0 |
| Australian Skills Quality Authority | 17 | 3 | 73 | 7 | 0 |
| Australian Transport Safety Bureau | 17 | 22 | 58 | 3 | 0 |
| Food Standards Australia New Zealand | 18 | 10 | 58 | 14 | 1 |
| National Anti-Corruption Commission | 17 | 9 | 73 | 1 | 0 |
| National Film and Sound Archive of Australia | 56 | 15 | 26 | 3 | 0 |
| National Health and Medical Research Council | 18 | 6 | 68 | 8 | 0 |
| National Museum of Australia | 54 | 15 | 30 | 1 | 0 |
| National Offshore Petroleum Safety and Environmental Management Authority | 30 | 23 | 46 | 1 | 0 |
| Office of Parliamentary Counsel | 37 | 15 | 42 | 6 | 0 |
| Office of the Australian Information Commissioner | 23 | 4 | 23 | 50 | 0 |
| Office of the Special Investigator | 56 | 13 | 31 | 0 | 0 |
| Productivity Commission | 15 | 15 | 63 | 6 | 0 |
| Safe Work Australia | 22 | 4 | 71 | 4 | 0 |
| Tertiary Education Quality and Standards Agency | 12 | 3 | 58 | 27 | 0 |
| Torres Strait Regional Authority | 74 | 15 | 9 | 2 | 0 |
Source: APS Employee Census
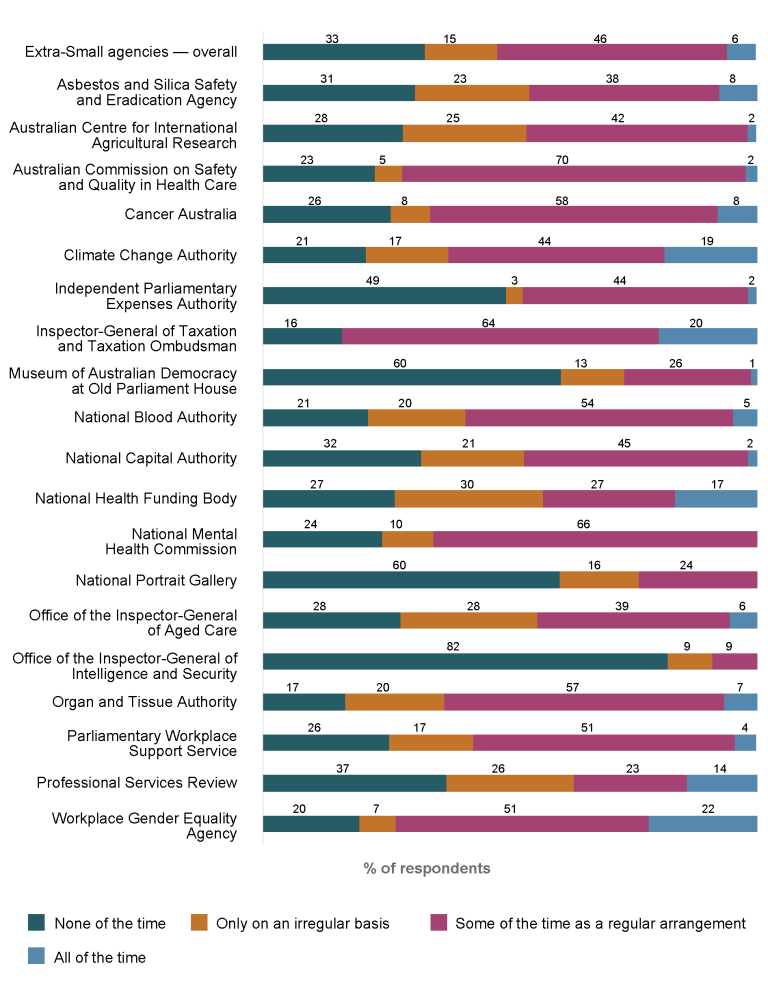
Figure AB 51: Extra-small agencies percentage of employees working away from the office (20 to 100 employees)
Source: APS Employee Census
Table AB 51: Extra-small agencies percentage of employees working away from the office (20 to 100 employees)
| Agency | % of respondents working away from the office | ||||
|---|---|---|---|---|---|
| None of the time | Only on an irregular basis | Some of the time as a regular arrangement | All of the time | Did not disclose their arrangement | |
| Extra-small agencies – overall | 33 | 15 | 46 | 6 | < 0.5 |
| Asbestos and Silica Safety and Eradication Agency | 31 | 23 | 38 | 8 | 0 |
| Australian Centre for International Agricultural Research | 28 | 25 | 42 | 2 | 3 |
| Australian Commission on Safety and Quality in Health Care | 23 | 5 | 70 | 2 | 0 |
| Cancer Australia | 26 | 8 | 58 | 8 | 0 |
| Climate Change Authority | 21 | 17 | 44 | 19 | 0 |
| Independent Parliamentary Expenses Authority | 49 | 3 | 44 | 2 | 2 |
| Inspector-General of Taxation and Taxation Ombudsman | 16 | 0 | 64 | 20 | 0 |
| Museum of Australian Democracy at Old Parliament House | 60 | 13 | 26 | 1 | 0 |
| National Blood Authority | 21 | 20 | 54 | 5 | 0 |
| National Capital Authority | 32 | 21 | 45 | 2 | 0 |
| National Health Funding Body | 27 | 30 | 27 | 17 | 0 |
| National Mental Health Commission | 24 | 10 | 66 | 0 | 0 |
| National Portrait Gallery | 60 | 16 | 24 | 0 | 0 |
| Office of the Inspector-General of Aged Care | 28 | 28 | 39 | 6 | 0 |
| Office of the Inspector-General of Intelligence and Security | 82 | 9 | 9 | 0 | 0 |
| Organ and Tissue Authority | 17 | 20 | 57 | 7 | 0 |
| Parliamentary Workplace Support Service | 26 | 17 | 51 | 4 | 2 |
| Professional Services Review | 37 | 26 | 23 | 14 | 0 |
| Workplace Gender Equality Agency | 20 | 7 | 51 | 22 | 0 |
Source: APS Employee Census


