Workforce size and distribution
The Australian Public Service workforce spans 583 locations across Australia in 101 agencies.
At 30 June 2024, the APS had 185,343 employees, working across 234 job roles in fields such as service delivery, research, regulation, project management and policy development.
The size of the APS relative to the population it serves, and to the wider labour force, has changed over time. Table 9 shows APS headcount in the context of the Australian population size, and the Australian labour force, over time.
Table 9: APS headcount as a proportion of Australian population and Australian labour force, over time
| June 2008 |
June 2012 |
June 2016 |
June 2020 |
June 2024 |
|
|---|---|---|---|---|---|
| APS employees | 159,299 | 167,343 | 155,607 | 150,360 | 185,343 |
| Australian population | 21,249,200 | 22,733,500 | 24,190,900 | 25,649,200 | 27,095,255 |
| APS employees as % of population | 0.75% | 0.74% | 0.64% | 0.59% | 0.68% |
| Employed persons | 10,487,557 | 10,958,923 | 11,507,887 | 11,733,447 | 13,647,452 |
| APS employees as % of employed persons | 1.52% | 1.53% | 1.35% | 1.28% | 1.36% |
Sources:
- APSED
- Estimated Residential Population (Australian Bureau of Statistics), National, state and territory population, Series: A2133251W, Population and components of change - national. The June 2024 estimate is a population projection figure: 'High Series' (Australian Bureau of Statistics (2022-base---2071), Population Projections, Australia
- Labour Force, Australia, (Australian Bureau of Statistics), Labour Force, Australia, Series: A84425129C (Labour force status for 15-64 year olds by Sex - Trend, Seasonally adjusted).
At 30 June 2024, the proportion of APS employees located in Victoria, Queensland, South Australia and Western Australia was higher, while the proportion located in the Australian Capital Territory, New South Wales, the Northern Territory and Tasmania was lower than a decade earlier (Table 10).
Table 10: Location of APS employees at 30 June (2015 and 2024)
| Location |
2015 |
2024 |
||
|---|---|---|---|---|
| Headcount |
% |
Headcount |
% |
|
| Australian Capital Territory |
58,079 |
38.1 |
68,435 |
36.9 |
| Victoria |
24,465 |
16.1 |
32,002 |
17.3 |
| New South Wales |
29,323 |
19.3 |
30,712 |
16.6 |
| Queensland |
16,646 |
10.9 |
24,180 |
13.0 |
| South Australia |
9,302 |
6.1 |
12,907 |
7.0 |
| Western Australia |
7,030 |
4.6 |
9,001 |
4.9 |
| Tasmania |
3,819 |
2.5 |
4,428 |
2.4 |
| Northern Territory |
2,192 |
1.4 |
2,158 |
1.2 |
| Total capital cities |
130,067 |
85.4 |
160,942 |
86.8 |
| Total regional |
20,789 |
13.7 |
22,881 |
12.3 |
| Overseas |
1,385 |
0.9 |
1,520 |
0.8 |
| All |
152,241 |
100.0 |
185,343 |
100.0 |
Source: APSED
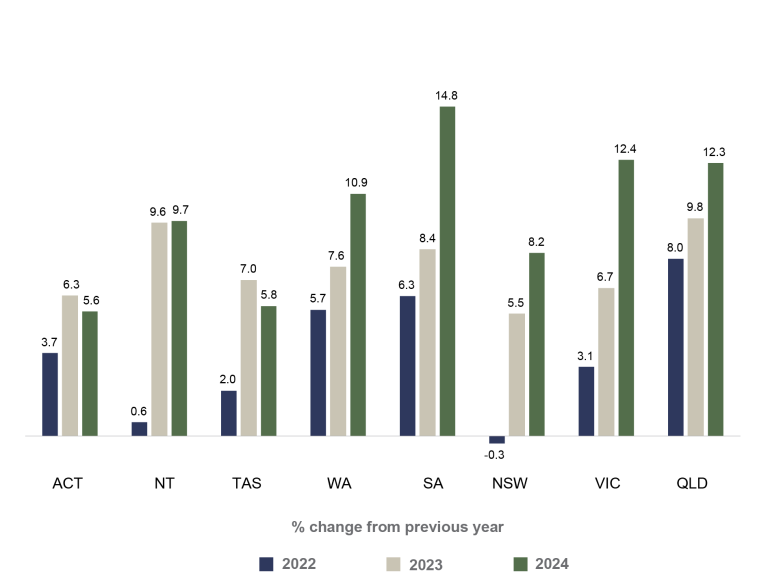
Year-on-year changes within the APS employee headcount in each state and territory over the 3 years to 30 June 2024 are shown in Figure 8.
Figure 8: Employee headcount (% change from previous year, 2022 to 2024)

Source: APSED
See also in this report
Working in the APS – APS Location Framework


