Right people, right place and right time
The composition and distribution of APS employees continuously shifts, partly in response to changes in Australian society. During more than a century of change the APS has maintained a proud history of managing its workforce well.
Today, the pace of change and the complexity of services place a premium on recruiting and retaining the right people. The APS operates in a competitive labour market when searching for talent. This means people strategies in the APS must be continuously reviewed and improved. The goal is to attract talented people and then equip them to embrace challenges and to perform competently.
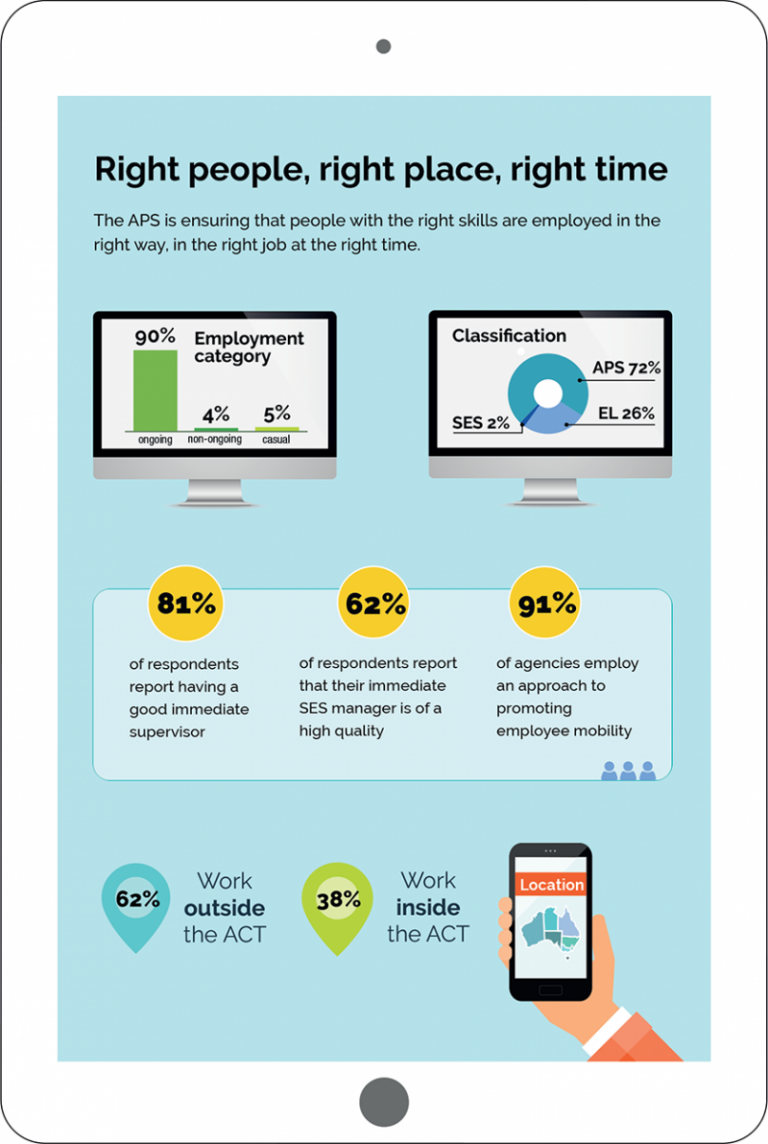
Employment categories
The APS workforce comprises ongoing, non-ongoing and casual1 employees. The right mix of employment categories will become more important as the APS embraces new policy and service delivery challenges.
At 30 June 2017, the APS workforce comprised 152,095 employees.2 Headcounts have remained at around this level since 2014 and reflect a 9 per cent reduction from 167,331 employees in 2012 (Figure 1).
Figure 1: Number of APS employees by employment type, 2000 to 2017

In 2017, 90 per cent of APS employees were employed on an ongoing basis.
The APS will continue to engage most of its workforce as ongoing personnel. This will guarantee continuity of knowledge, skills and experience. At the same time, non-ongoing employees will be required for specialised roles and tasks. Access to a flexible workforce of ongoing, non-ongoing and casual employees will be of growing importance as many dimensions of work become more complex.
Transformation of the workforce
The nature of work is being transformed.
Many people are embracing new forms of work often identified as contingent work. Peer-to-peer and gig workers and those engaged in job market places like Airtasker are categorised as part of the contingent workforce.
The APS is using these new forms of work that do not readily align with traditional methods of recruitment, procurement, location and supervision. The APS will have to adapt to make best use of transforming work offerings.
People choose to work in this manner because they value the independence, opportunity, freedom and flexibility they are afforded.
Enterprise Agreement bargaining
APS agencies negotiate their own enterprise agreements within a policy framework established by the Australian Government. During 2016–17 agencies bargained in accordance with the Workplace Bargaining Policy 2015.
The Workplace Bargaining Policy 2015 requires agencies to review and remove restrictive work practices from existing enterprise agreements. This includes removing content which prevents agencies from managing their business and delivering effective service to the broader community. Diversification of employment categories enables the right people to be employed at the right place at the right time. The changes to enterprise agreements encourage agencies to improve productivity and position themselves for the future. The agreements negotiated to-date have sensibly balanced the interests of agencies and their employees. The policy framework allowed salary increases of up to 2 per cent per annum over the life of an enterprise agreement.
During 2016–17, there were 39 successful enterprise agreement ballots across the APS. Employees at several large agencies voted up new agreements, including the Department of Agriculture and Water Resources, Department of Defence, Department of the Prime Minister and Cabinet and the Australian Taxation Office.
By the end of the 2016–17, over 60% of APS employees had voted up new enterprise agreements and only 19 APS agencies remained in bargaining. These agencies are expected to complete bargaining during 2017–18.
Geographic location
The APS employs staff across Australia and overseas. Location can be influential in enabling employees to effectively carry out their duties. Figure 2 shows the location of APS employees across the country.
Figure 2: Proportion of APS employees located within each Australian state and territory and overseas, 30 June 2017

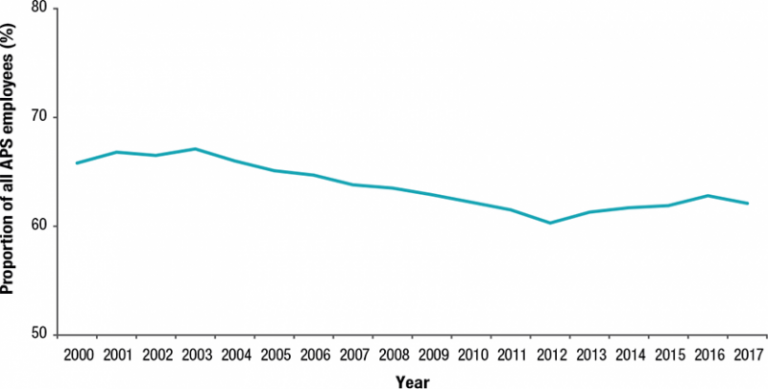
A common perception is that APS employees are mostly located in Canberra. The reality is that most work outside the ACT. At 30 June 2017, 62.1 per cent of the APS workforce were located in other states and territories.3 This increased from 60.3 per cent in June 2012 (Figure 3).
Figure 3: Proportion of APS employees located outside the Australian Capital Territory, 2000 to 2017
Service delivery agencies such as the Australian Taxation Office, the Department of Human Services and the National Disability Insurance Agency have broad geographic footprints. Agencies such as the Australian Trade and Investment Commission, Department of Defence, Department of Foreign Affairs and Trade, and Department of Immigration and Border Protection employ a significant number of APS employees overseas. Agencies such as the Attorney-General’s Department, Department of Industry, Innovation and Science and Department of Infrastructure and Regional Development have a smaller, though significant, overseas presence.
APS agencies will continue to employ people in the right locations to meet the expectations of government and deliver policy outcomes and services to the Australian people.
Classification levels
In 2017, 73.8 per cent of the APS workforce was employed at the APS 6 classification level or below.4 Executive Level (EL) employees accounted for 24.5 per cent of the APS workforce.
Since 2000, the APS workforce composition has shifted to encompass more employees at higher classification levels. EL and Senior Executive Service (SES) employees comprised 19 per cent of the APS workforce in 2000. In 2017, this had increased to 26.2 per cent (Figure 4).
Figure 4: Proportion of all APS employees at each substantive classification level, 30 June 2017

Like any organisation, the APS regularly assesses its workforce structure. The growth of EL employees warrants attention. Efficiency is often enhanced when flatter management structures are deployed. The APS is addressing this through span-of-control initiatives to reduce management layers. New forms of work are expected to disrupt management structures.
Leadership
Strong leadership and sound managerial skills are critical for maximising APS productivity. Leadership roles and responsibilities are most often associated with EL and SES positions. However, APS employees at all levels often exercise leadership.
The vast majority of APS employees speak highly of their immediate supervisor. Eighty-one per cent of respondents to the 2017 APS employee census report they have a good immediate supervisor. A similar proportion report that their immediate supervisor gives them responsibility and holds them to account for what they deliver. More than 80 per cent of employees also agree that their immediate supervisor encourages them to contribute ideas and has the appropriate level of skills, abilities and knowledge to perform their job.
APS employees’ views of SES managers are more measured. Sixty-two per cent of respondents to the 2017 APS employee census report that their immediate SES manager is of a high quality. The same proportion report that their immediate SES manager ensures that work effort contributes to the strategic direction of their agency and the APS.
Leadership development is a focus for the APS as it works to ensure employees have the capabilities required to deal with future challenges. The Australian Public Service Commission (APSC) leads efforts to develop leadership skills across the APS. Many agencies complement this with their own programs.
Leadership Development program
A new Leadership Development program for SES Band 2 officers was trialled during 2016–17. The program encouraged learning through experience. Participants were exposed to the views and experiences of organisations and individuals in receipt of government services.
Participants gained useful insights into the multi-faceted issues facing many communities because of government’s role in policy and service delivery.
Educational qualifications
The APS employs people with a broad range of educational qualifications. This reflects the broad range of activities the APS is responsible for delivering.
Sixty-five per cent of respondents to the 2017 APS employee census have a university qualification. Another 11 per cent hold a vocational qualification. The most common fields of study among respondents with university qualifications are arts and social sciences as well as economics, commerce and accounting.
The educational profile of the APS workforce differs between agencies. More technical and scientifically-focused agencies such as the Bureau of Meteorology, Geoscience Australia and IP Australia employ a higher proportion of people with doctoral degrees than other agencies.
The inevitable growth of digital innovation and emerging technologies will require an increase in the proportion of employees with technology-related qualifications.
Learning and development
Learning and development offerings ensure employees have the skills and knowledge to be productive. Responses to the 2017 APS employee census highlight that most employees proactively seek learning and development opportunities. Eighty-five per cent of respondents indicate they take responsibility for their own learning and development. Eighty-three per cent said they are aware of the areas they needed to develop to perform better.
The APSC is reviewing its learning and development strategy for the APS. The revised strategy will aim to secure the leadership and other skills that APS employees need for future challenges.
Agencies have identified their own short and medium-term learning and development needs. Agencies have most commonly identified management and leadership training as a priority. Most have also nominated specific or specialist skills relevant to their core business.
Agency-specific needs augment offerings related to whole of APS priorities.
Management in Action program
This year the APSC’s Centre for Leadership and Learning released a Management in Action program to build manager capability across the APS. The program was developed and piloted in collaboration with the Attorney-General’s Department and the Department of Immigration and Border Protection. The program builds EL manager capability by focusing on scenario-based exercises that provide theory and practice in business planning, exercising delegations and understanding responsibilities as a manager. Results have been encouraging and the program will be reviewed to ensure relevance into the future.
Mobility
Employee mobility is a key driver for maximising APS productivity. Mobility between APS agencies and with the state, territory and private sectors is encouraged. Mobility allows employees to acquire new skills and receiving agencies benefit from a broader range of knowledge and expertise.
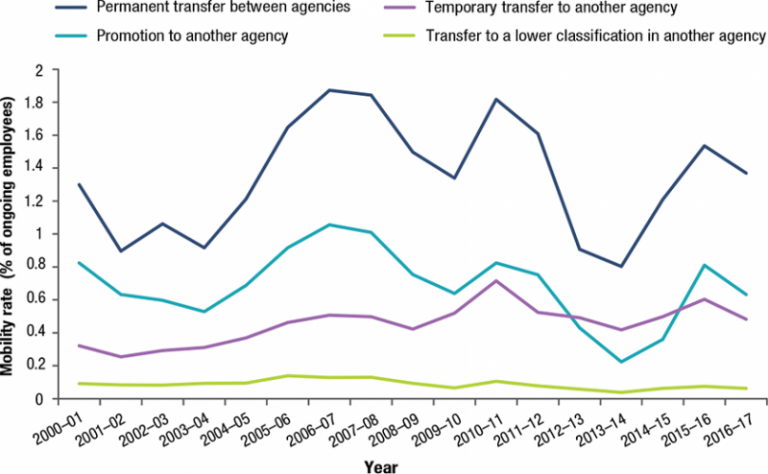
Data indicates that mobility fluctuates year on year (Figure 5). Two and a half per cent of ongoing APS employees moved between APS agencies in 2016–17. Employee mobility is expected to take on greater importance and become more common.
Figure 5: Mobility rates of ongoing APS employees between APS agencies, 2000–01 to 2016–17
Results of the 2017 APS employee census indicate that APS employees are generally willing to explore options for mobility:
- 40 per cent of respondents report an interest in temporarily transferring to another agency
- 25 per cent of employees report an interest in temporarily transferring to the private sector.
Workforce planning
Workforce planning is critical to the effective management of the APS. Clear strategies and well-informed workforce plans enable the APS to employ its workforce effectively and efficiently.
The vast majority of APS agencies conduct some form of workforce planning. They are also committed to improving their capabilities in this area. Eighty-nine per cent reported that they are seeking to improve their workforce planning capabilities over the next three years. When asked about top workforce information priorities in 2017, agencies identified some common themes, including predicting employee turnover, monitoring workforce movement and trends, and developing strategic workforce plans and talent management strategies.
APS job family model
The APSC revised the APS job family model during 2016–17. This revision occurred in collaboration with several APS agencies.
The model provides a basis for identifying, articulating, analysing and managing the functional and capability requirements of a workforce including the associated risks these pose to business deliverables.
For more details on the APS job family model:
Diverse and representative
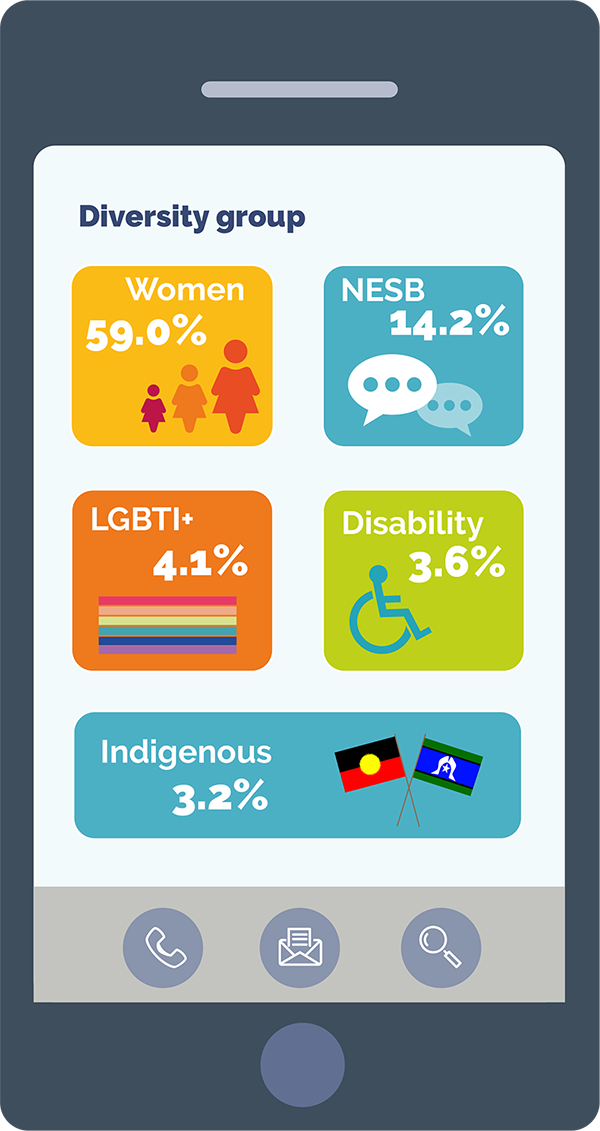
An APS that reflects the diversity of the population it serves can better anticipate and cater to the differing needs of the community. The APS seeks employees from various backgrounds and experiences because this fosters diversity of thought, perspective and problem-solving. In addition, employees grow and adapt as they learn from others. Figure 6 illustrates some aspects of diversity and representation in the APS.
Figure 6: Aspects of diversity and representation in the APS
A culture of inclusion
It is possible to attract, but difficult to retain, a diverse workforce without an inclusive culture. Diversity and inclusiveness must be reflected as priorities by leaders and in teams. Responses to the 2017 APS employee census show that almost 90 per cent of APS employees agree that their workgroup and supervisor behave in an accepting manner towards people from diverse backgrounds. Three-quarters of respondents agree their agency is committed to creating a diverse workforce.
Over the past decade, the APS has made a considered effort to remove barriers that have limited the opportunities, inclusion and recognition of potential employees from diverse backgrounds. Most employees who identify as part of a diversity group agree their workgroups and supervisors accept and support diversity, and that APS agencies are committed to providing equal opportunities.
The APS leadership helps drive initiatives to break down formal and informal barriers to an inclusive and respectful workplace for all. To demonstrate the importance of diversity and inclusion, the Secretaries’ Equality and Diversity Council was formed.
Women
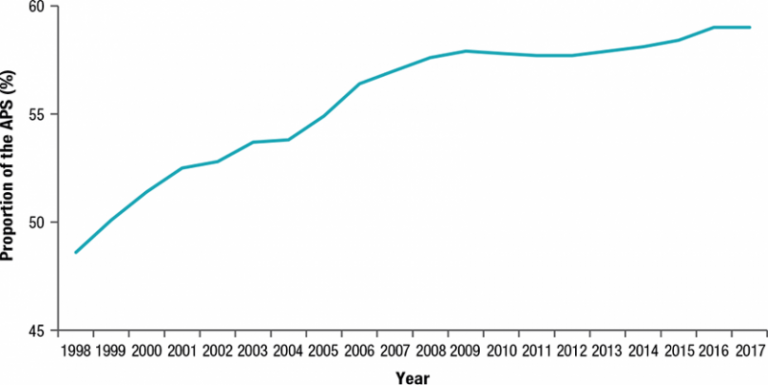
Rates of female participation in the APS have steadily increased over time, as shown in Figure 7. The most recent data shows that almost 60 per cent of the APS workforce is female.
Figure 7: Proportion of women in the APS over time
Balancing the Future: APS Gender Equality Strategy 2016–19 was launched in April 2016. Since then, significant activity has occurred across the APS as agencies implement the strategy through agency-specific gender action plans.
More than 60 per cent of 2017 APS employee census respondents agree their SES manager actively supports opportunities for women to access leadership roles.
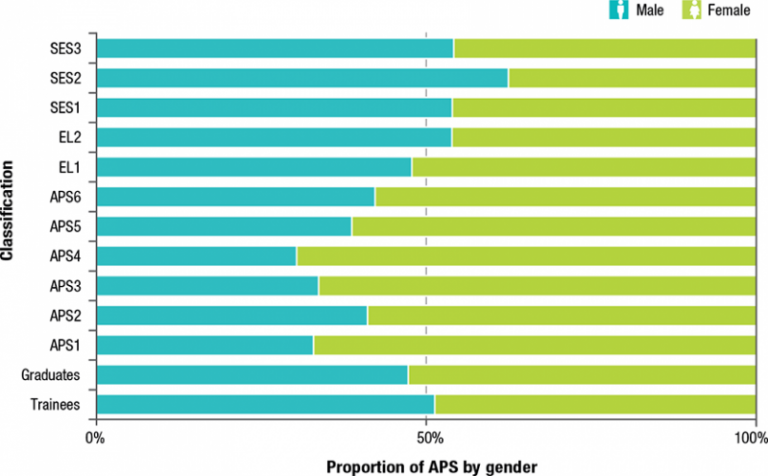
In 2017, the proportion of women in ongoing positions showed a steady increase across the EL 1 classification. EL 2 and SES roles still require further effort as the APS continues working towards parity (Figure 8).
Figure 8: Comparison of women versus men at each classification
Aboriginal and Torres Strait Islander peoples
The Commonwealth Aboriginal and Torres Strait Islander Employment Strategy aims to build Indigenous employment within the APS. It supports the government’s target of 3.8 per cent Indigenous employment in the APS by 2018. The APS Employment Database data shows that the representation of ongoing Indigenous employees is just over three per cent.
Most Indigenous employees in the APS occupy trainee, graduate and APS 1–6 positions. Almost four per cent of positions up to APS 6 are held by Indigenous employees, continuing a steadily increasing trend in Indigenous employment since 2012. This also reflects APS-wide efforts to offer a range of entry pathways for Indigenous employees and to improve career development opportunities for existing employees. In comparison, Indigenous representation within EL and SES classifications has remained relatively static.
APS Indigenous capability
The APSC is working with agencies under a memorandum of understanding to build cultural capability across the APS. This includes retaining and developing Indigenous employees to increase representation at all levels. Initiatives under the memorandum include a streamlined whole of government APS Indigenous Recruitment Program and a cross-agency, cross-cultural Indigenous Mentoring Program.
Disability
Approximately one in five Australians identify as a person with disability.5 Improving the representation of people with disability in the workforce enables the APS to better respond to the needs of the community. The As One: Making it Happen, APS Disability Employment Strategy 2016–19 aims to improve the representation and employment experience of people with disability in the APS.
The Australian Public Service Commissioner’s Directions 2016 included an expanded affirmative measure for disability employment. This allows an agency head to specify a vacancy as open only to people with disability or a particular disability.
Strategies implemented by APS agencies in 2016–17 were designed to broaden the range of employment opportunities for people with disability. Some of these strategies included participation in RecruitAbility6, dedicated internships for people with disability, and partnering with recruitment agencies specialising in assisting candidates with disability to enter the workforce.
Non-English speaking background
The proportion of APS employees from non-English speaking backgrounds has increased by almost five percentage points in the last 20 years. In 2017, 14 per cent of employees were recorded on their agency human resource system as being from non-English speaking backgrounds. Nearly three-quarters of these were employed at APS level classifications.
Age
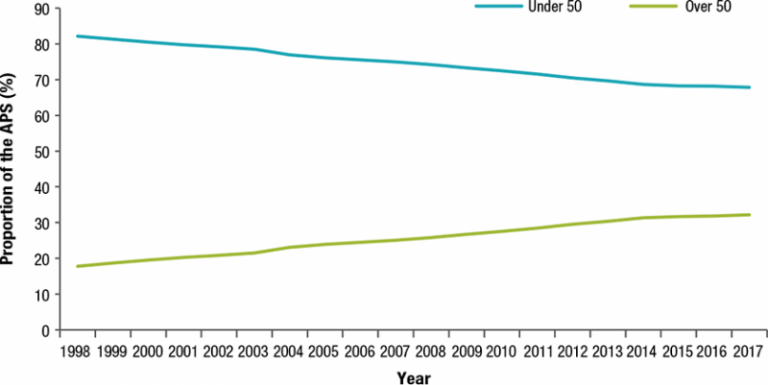
Age diversity offers the advantage of different skills and experience. Most APS employees are between 30 and 54 years of age, with the median age category 40 to 44 years of age. Thirteen per cent of employees are less than 30 years of age and 18 per cent are more than 54 years of age. The average age of the APS has risen over the last 20 years. The percentage of employees 50 years and over continues to increase (Figure 9).
Figure 9: Age group classifications over time
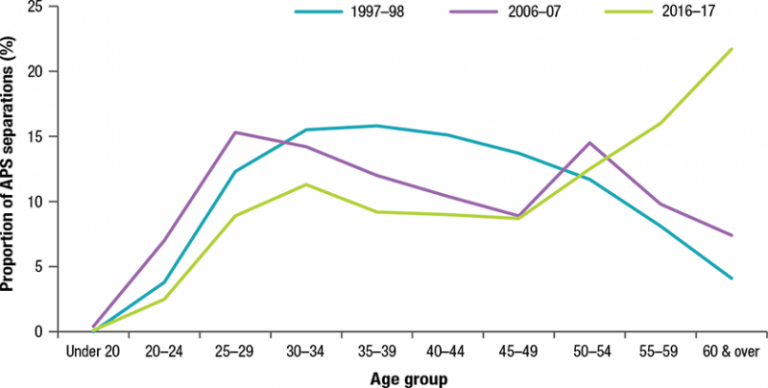
Twenty years ago, most ongoing employee separations occurred in the 30 to 50 age groups (Figure 10). Ten years ago, the highest ongoing employee separation rates occurred in the 25 to 29, 30 to 34, and 50 to 54 age brackets. In 2016–17, nearly half of separations occurred in the 50 and above age brackets, with the proportion of separations increasing with increasing age. This suggests that employees are staying longer and that separations in higher age brackets are largely due to employees retiring.
Figure 10: Separations of ongoing employees
1 Employees engaged under Section 22(2)(c) of the Public Service Act 1999.
2 APS Employment Database
3 APS Employment Database
4 APS Employment Database
5 Australian Bureau of Statistics. 2015 Survey of Disability, Ageing and Carers
6 http://www.apsc.gov.au/managing-in-the-aps/disability/recruitabilityarc…


