Diversity
The APS employment database records diversity information in relation to gender, Aboriginal and/or Torres Strait Islander (Indigenous) status, disability status and employees from a culturally diverse background. Culturally diverse background in this chapter is mostly measured through data on non-English speaking background (NESB). With the exception of gender, the provision of diversity data is voluntary; therefore, not all APS employees have provided a response to each field. As a result, diversity rates represent the proportion of employees who identify as belonging to that diversity group, and actual diversity rates may be underestimated.
The annual APS Employee Census, which is voluntary and de-identified, tracks similar diversity information to the APS employment database. Additionally, the Census captures the number of employees who respond and identify as Lesbian, Gay, Bisexual, Transgender and/or gender diverse, Intersex, Queer, Questioning and/or Asexual (LGBTIQA+). Diversity metrics, captured throughout APS-wide workforce datasets are reported in the Commissioner’s State of the Service Report.
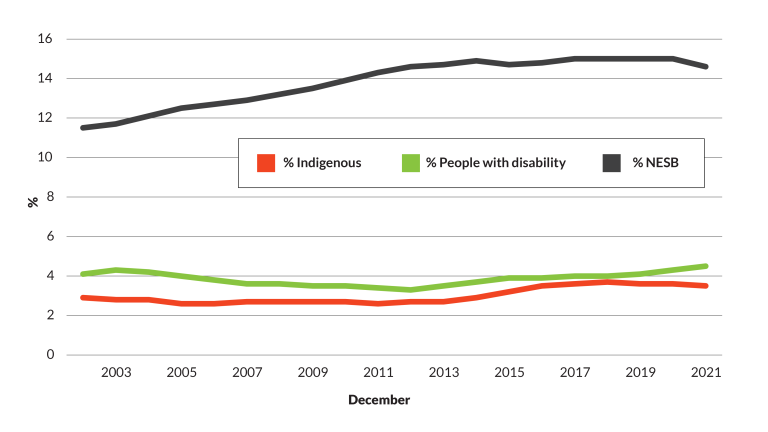
Employment data from the APS employment database shows that employee diversity has either plateaued or reduced slightly in 2021. This can mostly be explained by the large increase in non-ongoing employees during 2021 in response to the COVID-19 pandemic. Non-ongoing employees have a greater proportion of missing data for diversity (50% or more) than ongoing employees, and in some cases this has caused a proportional decrease despite actual diversity numbers not having dropped. For example, the number of employees from a non-English speaking background (NESB) increased by 512 in 2021 yet the proportional representation dropped from 15.0% to 14.6%.
Figure 3.1: Diversity proportions of all APS employees from December 2002 to December 2021
Source: APSED December 2021 Table 77
Aboriginal and/or Torres Strait Islander (Indigenous)
At 31 December 2021, there were 5,484 employees (3.5% of the APS) who identified as Indigenous. Indigenous representation has increased steadily from 2.6% in December 2012, which was the lowest recorded proportion (Figure 3.1).
At the end of the 2021 calendar year, the largest proportion of Indigenous employees worked in Services Australia (34.0% of total Indigenous employees), the Australian Taxation Office (9.8%), the Department of Defence (6.8%) and the National Indigenous Australians Agency (5.7%).
Agencies that employed a high proportion of Indigenous employees amongst their staff were the Torres Strait Regional Authority (76.4%), Aboriginal Hostels Ltd. (50.1%), the Australian Institute of Aboriginal and Torres Strait Islander Studies (25.6%) and the National Indigenous Australians Agency (24.5%).
Of the 5,484 Indigenous employees at 31 December 2021, 80.4% (4,409) have job family data recorded. Of these, 42.0% (1,851) worked in Service Delivery with the majority (1,204) specifically employed in a Call or Contact Centre role.
At 31 December 2021, Indigenous employees were mostly located in Queensland (26.5%), the Australian Capital Territory (25.6%), New South Wales (18.0%) and the Northern Territory (9.0%). A high proportion of Indigenous employees were located in regional Australia (33.9%) in comparison to the total proportion of APS located in regional Australia (13.6%).
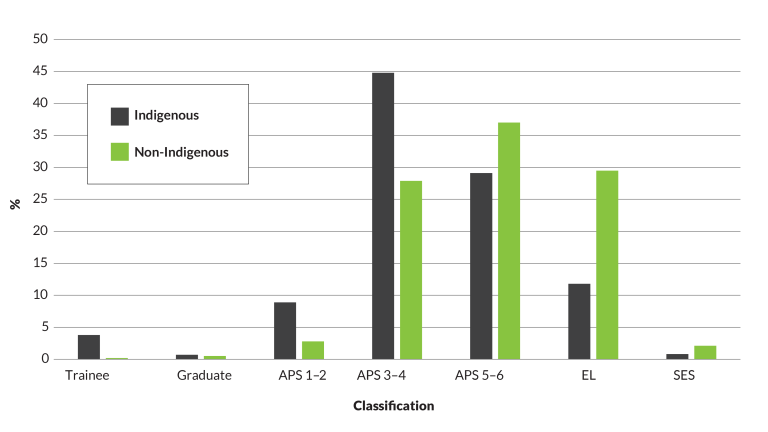
Almost half of Indigenous employees work at the APS 3-4 classification levels (Figure 3.2).
Figure 3.2: Classification breakdown by Indigenous status, 31 December 2021
Source: APSED December 2021 Table 82
Indigenous employees on average have much shorter careers in the APS compared to non-Indigenous employees. This has been a consistent trend over the last 20 years. Whereas the median length of service of Indigenous employees has remained relatively constant over the last 20 years, that of non-Indigenous employees has increased (Figure 3.3). In 2021, the median length of service at separation for Indigenous employees was 4.3 years compared to 10.9 years for non-Indigenous employees.
Figure 3.3: Median length of service at separation, Indigenous and non-Indigenous employees (2002 to 2021)

Disability
At 31 December 2021, there were 6,970 employees who identified as having a disability*, an increase of 628 employees (or 9.9%) from December 2020. The proportion of employees who identified as having a disability was 4.5%, a slight increase from 4.3% in 2020. The proportion of APS employees with a disability has increased from 3.3% in December 2012 (Figure 3.1). The number and proportion of employees with a disability at December 2021 was the highest it has been over the past 20 years.
Agencies that employed a high proportion of employees with a disability at 31 December 2021 were the National Disability Insurance Agency (10.3%), Safe Work Australia (10.1%), the Australian Public Service Commission (8.8%) and the NDIS Quality and Safeguards Commission (7.6%).
Of the 6,970 employees with a disability at 31 December 2021, 88% (6,111) have job family data recorded. Of these, 30.4% (2,119) worked in Service Delivery. In comparison, 16.9% of employees without a disability were employed in the same job family. In particular, 18.4% of employees with a disability worked in a Call or Contact Centre role, which is almost double that of employees without a disability (9.9%).
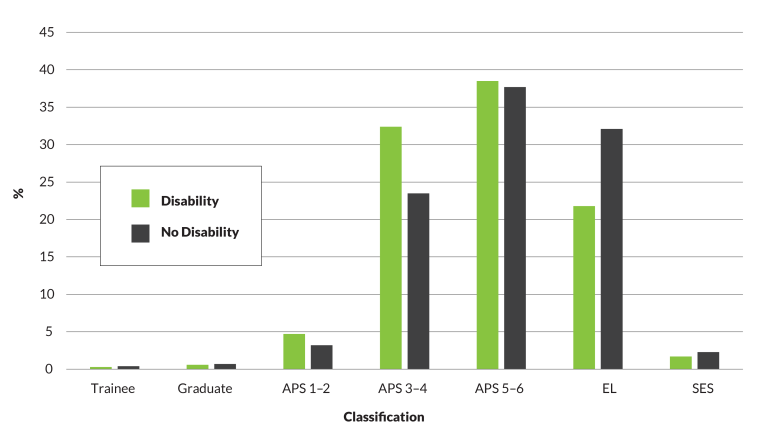
At 31 December 2021, the classification distribution of employees with a disability largely mirrored that of employees without a disability, with the exception of APS 3-4 and EL classifications (Figure 3.4). At the APS 3-4 classifications, employees with a disability were in greater relative proportion than employees without a disability, while at the EL level the reverse was reported. This difference may be explained by the high proportion of employees with a disability working in Service Delivery where most roles in this job family are at the APS 3-4 classifications.
Figure 3.4: Classification breakdown by disability status, 31 December 2021
Source: APSED December 2021 Table 82
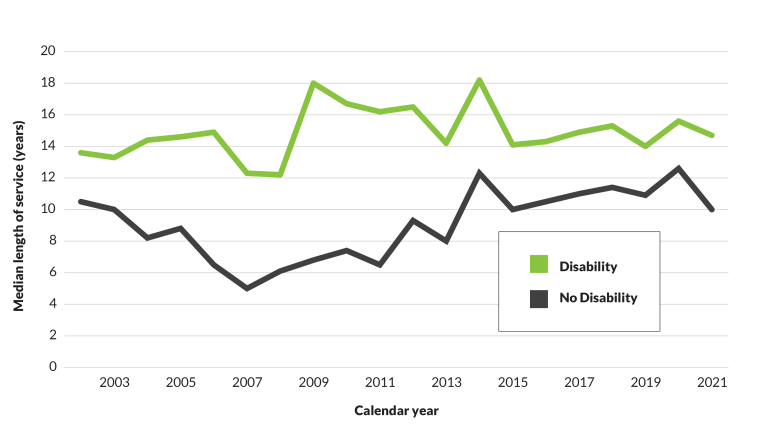
Employees with a disability on average have longer careers in the APS than employees without a disability. This has been a consistent trend over the last twenty years (Figure 3.5).
Figure 3.5: Median length of service at separation, employees with and without a disability (2002 to 2021)
Cultural and linguistic diversity
APS employment data has historically been collected to inform metrics labelled ‘Non-English speaking background (NESB)’. These metrics are split into two components: NESB 1 refers to people born overseas who arrived in Australia after the age of five and whose first language was not English; NESB 2 refers to children of migrants. At 31 December 2021, 5.2% of the APS identified as NESB 1, while 9.4% were NESB 2.
Prior to 2021, the combined proportion of NESB 1 and NESB 2 employees had increased from 11.5% in 2002 to 15.0% in 2020. However, the combined proportion of employees with a NESB status has dropped slightly to 14.6% in 2021 (Figure 3.1). This proportional decrease is mostly due to the significant increase in non-ongoing employees in 2021 who commonly do not report diversity data. The overall number of APS employees with a NESB status has actually increased by 512.
The Australian Bureau of Statistics defines the CALD population mainly by country of birth, language spoken at home, self-reported English proficiency, and Indigenous status (ABS Standard for Statistics on Cultural and Language Diversity (ABS cat. No. 1289.0) 1999), all data elements collected in the APS employment database.
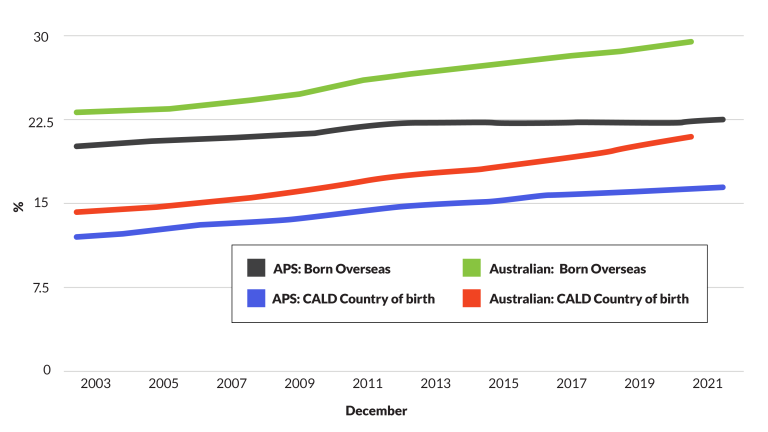
At 31 December 2021, 22.4% of APS employees were born overseas with 16.4% from a culturally and linguistic diverse country (non-English speaking). Since 2002, there has been an increase in the proportion of APS employees born overseas, especially those coming from non-English speaking countries (Figure 3.6). These trends mirror that of the Australian population with 29.7% of Australians being born overseas and 20.9% of Australians from a culturally and linguistic diverse country (ABS Migration, Australia, 2018–19 (ABS cat. No. 3412.0) 2020). The proportion of APS employees born overseas is consistently lower than that of the Australian population (Figure 3.6).
Figure 3.6: Proportion of culturally and linguistically diverse employees December 2002 – December 2021
Source: 31 December 2021 APSED and ABS Migration survey
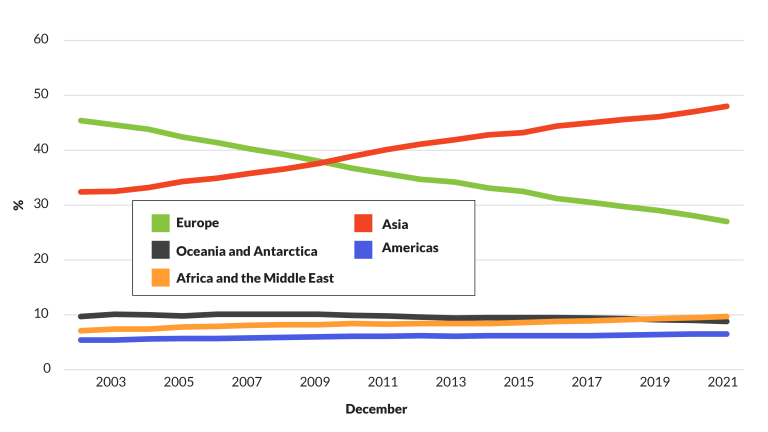
Excluding APS employees born in Australia, at 31 December 2021 most other employees were born in either Asia (48.0%) or Europe (27.0%). Since 2002, there has been a significant increase in employees from Asia and a corresponding decrease from Europe (Figure 3.7). In 2010, the number of APS employees born in Asia outnumbered those born in Europe for the first time. Other country of birth regions make up less than 10% each and have only changed marginally over the last two decades. Compared to the Australian population, the proportion of APS employees born in Asia is relatively high while all other regions have a slightly lower representation.
Figure 3.7: Proportion of APS employees born overseas at December 2002 – December 2021
At 31 December 2021, the most common overseas country of birth was India (12.7%). This marks the first time that England was not the number one country of birth for APS employees born overseas. The proportion of APS employees born in England has dropped from 23.8% in 2002 to 12.6% in 2021. At 31 December 2021, seven of the top ten country of births were from the Asian region (APSED December 2021 Table 78). In particular, the proportion of employees born in India and China has increased over the last two decades.
| As at 31 December 2021, the most common overseas countries of birth for APS employees were: | |

India 12.7% | 
England 12.6% |

China 5.9% | 
New Zealand 5.2% |
Gender
The APS employment database classifies data into three categories of gender: Male, Female and X. ‘X’ represents individuals who are indeterminate, unspecified or intersex. The overall proportion of women in the APS was 60.3% at 31 December 2021. This is a slight increase from 59.9% in 2020. The proportion of women in the APS has increased steadily from 53.2% in December 2002 (APSED December 2021 Table 77). Women make up an even higher proportion of non-ongoing employees (63.5% in 2021) but unlike ongoing employees, this proportion has changed little over the last 20 years (APSED December 2021 Table 77).
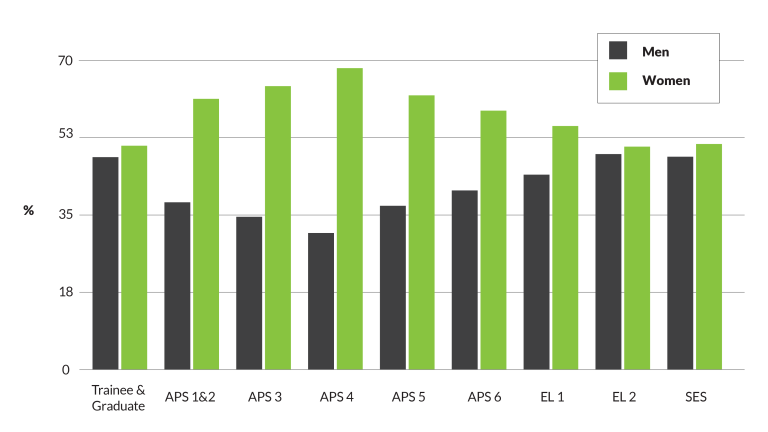
Women have reached, and in most cases exceeded parity with men at every level up to and including the collective SES cohort (Figure 3.8). There is still a lower proportion of women at the individual SES 2 (46.2%) and SES 3 (44.1%) bands. Women make up 63.1% of employees at the APS classifications and 54.1% at the EL classifications. The proportion of women in the SES continues to rise, increasing from 48.9% to 51.4% over the last calendar year. In 2002, women only made up 29.0% of the SES (APSED December 2021 Table 11).
During the 2021 calendar year, 59.3% of employees joining the SES were women. This proportion is the highest ever recorded. The 2014 calendar year was the first time that the number of women (26) entering the SES cohort outnumbered men (25). This trend has continued, except for 2017 when the proportion of women was 48.2%.
Women represent just 42.8% of the SES over the age of 54 (APSED December 2021 Table 27), and represent only 38.2% of ongoing SES separations during 2021 (APSED December 2021 Table 66).
Figure 3.8: Proportion of APS employees by classification and gender, 31 December 2021
Source: APSED December 2021 Table 11
*For data collection purposes, all APS agencies use the Australian Bureau of Statistics Disability, Ageing and Carers: Summary of Findings 2003 definition, according to which ‘… a person has a disability if they report that they have a limitation, restriction or impairment, which has lasted, or is likely to last, for at least 6 months and restricts everyday activities.’


