Size and shape of the APS
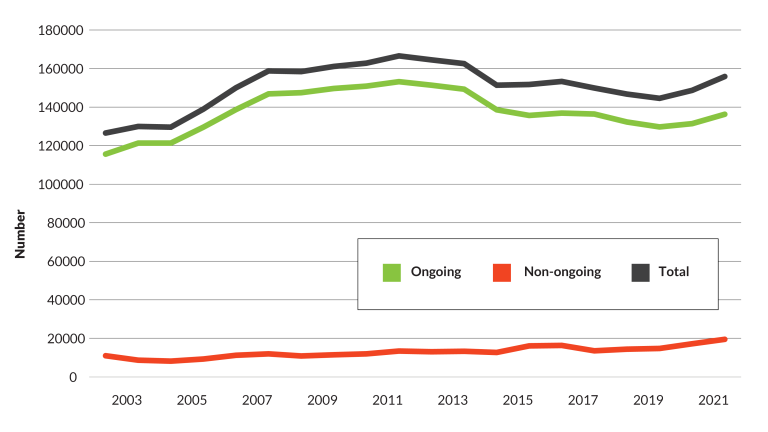
At 31 December 2021, there were 155,796 employees in the Australian Public Service (APS), an increase of 7,170 employees (4.8%) from the same time in 2020. Most of this increase (5,319 or 3.6%) was in the first six months of 2021 when the APS was responding to the COVID-19 pandemic. From 30 June 2021 to 31 December 2021, there was a further increase of 1,851 (1.2%) employees.
APS employee numbers have fallen by 6.9% from their peak of 167,339 in June 2012.
Figure 2.1: APS employee headcounts, December 2002 – December 2021

Source: APSED December 2021 Table 1
At 31 December 2021, the APS included:
- 136,284 ongoing employees (87.5%)
- 19,512 non-ongoing employees (12.5%), of which:
- 10,816 were employed for a specified term or task
- 8,696 were employed on an irregular or intermittent basis, known as ‘casual’ employees.
Fluctuations in the overall headcount occur for many reasons including seasonal patterns, business and government requirements and demand. The largest increases (excluding Machinery of Government changes) over the 2021 calendar year were:
- Services Australia had an overall increase of 2,627 staff, driven by an increase of 2,286 non-ongoing employees
- The Department of Health had an overall increase of 934 staff, of which 633 were ongoing and 301 were non-ongoing.
- The Australian Electoral Commission had a total increase of 854, of which 42 were ongoing and 812 were non-ongoing.
- The Australian Bureau of Statistics had a total increase of 724, of which 145 were ongoing and 579 were non-ongoing.
- The National Disability Insurance Agency had a total increase of 638. This figure includes an increase of 930 ongoing and a decrease of 292 non-ongoing employees.
The largest decreases (excluding Machinery of Government changes) over the 2021 calendar year were:
- The Department of Defence had a total reduction of 712 of which 652 were ongoing and 60 were non-ongoing.
- The Department of Home Affairs had a total reduction of 678 of which 607 ongoing and 71 non-ongoing.
- The Australian Taxation Office had a total reduction of 619. This figure included an increase of 980 ongoing and a decrease of 1,599 non-ongoing employees.
At 31 December 2021, the largest four agencies in the APS accounted for 53.6% (83,560 employees) of the total APS workforce. This included Services Australia (21.4%), the Australian Taxation Office (13.0%), the Department of Defence (10.6%) and the Department of Home Affairs (8.6%) (APSED December 2021 Table 5).
During the 2021 calendar year, there were 294 employee movements between APS agencies due to Machinery of Government changes (Appendix 2). The majority of these transfers were into:
- Department of Treasury from the Department of Industry, Science, Energy and Resources (85)
- The National Recovery and Resilience Agency from the Department of Prime Minister and Cabinet (77)
- The National Recovery and Resilience Agency from the Department of Home Affairs (45)
- The Australian Public Service Commission from the Digital Transformation Agency (31).
During the 2021 calendar year, a number of other changes occurred to the APS structure that had an effect on the spread of headcounts across the APS. See Appendix 2 for details of these coverage changes, along with a historical breakdown of employee numbers moving in and out of coverage of the Public Service Act 1999 from 2002.
Ongoing
There were 136,284 ongoing employees at December 2021, an increase of 4,840 from the same time last year. This is the highest number of ongoing employees since December 2017. Ongoing employees make up 87.5% of the APS workforce, down slightly from 88.4% in 2020. The proportion of ongoing employees has changed very little over the last 20 years, hovering around 90%.
Non-ongoing
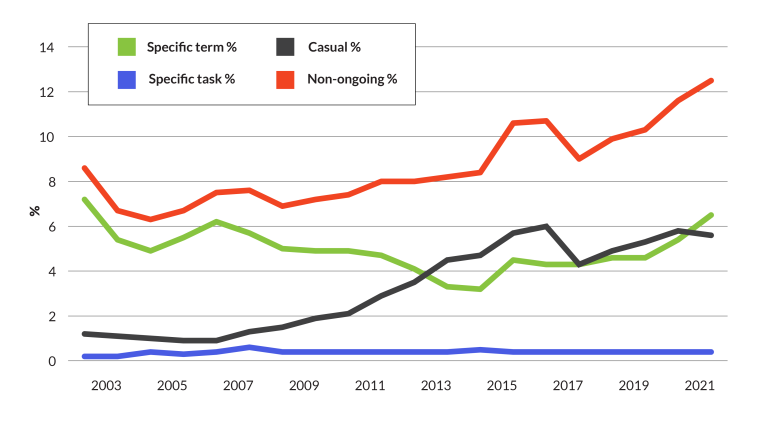
The number of non-ongoing employees has increased by 2,330 over the 2021 calendar year and as at 31 December 2021 equated to 12.5% of the APS. All of this increase (2,811) occurred in the first half of 2021. In the second half of 2021, non-ongoing employees actually decreased by 481. Other than at June 2021, this is the highest number and proportion of non-ongoing employees in the last 20 years. Non-ongoing employment consists of three distinct sub-groups: specified term, specified task, and irregular or intermittent (casuals). Of the non-ongoing employees, specified term employees represented 52.1%, specified task employees represented 3.3%, while casuals made up 44.6% at 31 December 2021.
The proportion of ‘specified term’ non-ongoing employees as part of the whole APS workforce at December 2021 was 6.5%, up from 5.4% in the previous year. The proportion of ‘specified term’ non-ongoing employees has more than doubled since 2014 and is the highest representation since 2002 (Figure 2.2). For the first time since 2012, there were more ‘specified term’ non-ongoing employees than casuals.
The proportion of casuals as part of the whole APS workforce has also risen since 2006 (Figure 2.2). As at 31 December 2021, the proportion of casual employees was 5.6%, down slightly from 5.8% in December 2020. Agencies that employed a high number of casuals as at 31 December 2021 were Services Australia (3,396, 39.1% of all casuals), the Australian Taxation Office (1,429, 16.4%), the Australian Electoral Commission (1,278, 14.7%) and the Australian Bureau of Statistics (740, 8.5%). Almost all casual employees (96.9%) are engaged at the APS 1–4 classifications.
Figure 2.2: Composition of non-ongoing employees, December 2002 – December 2021

APS Characteristics
Age Profile
The average age of APS employees was 43.5 years as at 31 December 2021 (APSED December 2021 Table 86). This is a slight decline since 2019 (43.7 years), which can be explained by the large increase of non-ongoing employees who are on average younger. Over the longer term however, the average age of APS employees has increased steadily from 40.3 years in 2002. This is in line with the trends in ageing across the general Australian workforce (ABS 3101.0 – Australian Demographic Statistics, June 2021). The proportion of the APS population that are 50 years or older has increased from 21.3% in 2002 to 33.1% in 2021 (Figure 2.3). At 31 December 2021, there were 8.6% of APS employees aged 60 years and above. The number of employees under the age of 30 has declined from 17.7% in 2002 to 13.7% in 2021(APSED December 2021 Table 26).
Figure 2.3: Proportion of age groups between 2002 and 2021

Classification Structure
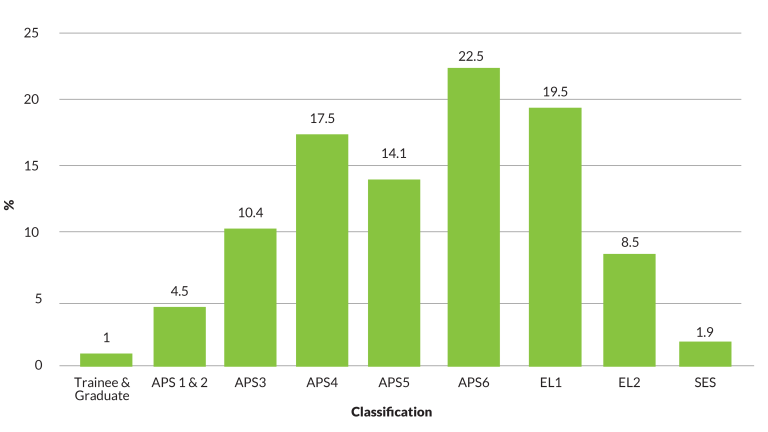
At 31 December 2021, the most common classification across the APS was APS 6 (Figure 2.4). The proportion of APS 6 employees has increased from 18.3% in 2002 to 22.5% in 2021. In 2002, the most common classification was APS 4 (24.4%) and in 2021 this classification represented only 17.5% of employees. The largest shift over the last 20 years has been at the EL 1 classification, increasing from 12.2% in 2002 to 19.5% in 2021(APSED December 2021 Table 11).
Figure 2.4: Proportion of APS employees by classification, at 31 December 2021

Source: APSED December 2021 Table 11
Geographic distribution of the APS
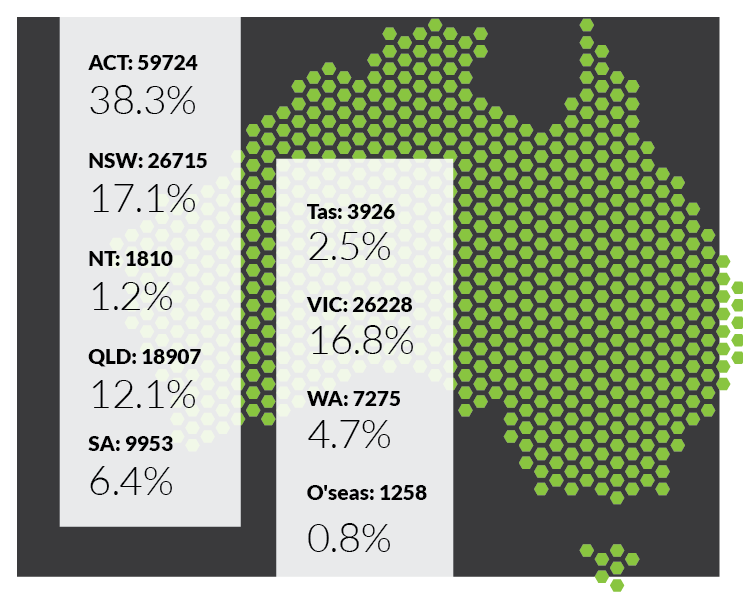
At 31 December 2021, the largest number of APS employees were located in the Australian Capital Territory (59,724), which represented 38.3% of the whole APS (Figure 2.5). Collectively, the three largest states by population (New South Wales, Victoria and Queensland) made up just over 46% of the APS workforce with a total of 71,850 employees.
Figure 2.5: APS employee headcounts and proportion by States and Territories at 31 December 2021

Source: APSED December 2021 Table 15
Regional distribution of APS
As at 31 December 2021, almost one in seven (21,258) or 13.6% of APS employees were located in regional areas outside capital cities. This is an increase of 1,074 from the previous year, although the proportional representation remains unchanged. The growth in regional numbers has predominantly occurred in Victoria (484 or 11.2%) and Queensland (430 or 8.5%) (APSED December 2021 Table 16).
In regional areas, New South Wales had the highest proportion of such employees at 40.8%, followed by Queensland (25.7%) and Victoria (22.6%). The proportion of the APS working in the capital cities (other than Canberra) has declined from 52.8% in 2003 to 47.2% in 2021 (APSED December 2021 Table 16).
International service
A total of 1,258 APS employees were located overseas at the end of the 2021 calendar year. This is an increase of 129 (11.4%) from the previous year. Agencies that employed large proportions of overseas staff included 880 employees in the Department of Foreign Affairs and Trade (70.0%), 147 in the Department of Home Affairs (11.7%), 125 in the Department of Defence (9.9%), and 71 in the Australian Trade and Investment Commission (5.6%) (APSED December 2021 Table 13).


