State of the Service Report 2020-21
The Hon Ben Morton MP
Minister Assisting the Prime Minister and Cabinet
Minister for the Public Service
Special Minister of State
Parliament House
Canberra ACT 2600
Dear Minister
In accordance with Section 44(1) of the Public Service Act 1999, I present you with my report on the state of the Australian Public Service for 2020–21.
Section 44(3) of the Public Service Act 1999 requires that this report is laid before each House of Parliament by 30 November 2021.
Yours sincerely
Peter Woolcott AO
Australian Public Service Commissioner
29 November 2021
Preface
Section 44 of the Public Service Act 1999 (Cth) stipulates that the Australian Public Service Commissioner issue a report each year to the agency’s Minister for presentation to the Australian Parliament. It is required to report on the state of the Australian Public Service (APS) during the past year.
The State of the Service Report 2020–21 identifies year-to-year trends in workforce participation and capability across the APS.
This is the 24th annual report on the state of the APS presented to Parliament.
The report is informed by the results of the 2020 and 2021 APS Employee Census. It is also draws on the APS Employee Database, the APS Agency Survey, and other data collections and research undertaken to evaluate the APS during the past year.
The appendixes to the State of the Service Report 2020–21 comprise:
- APS workforce information sources
- APS agencies
- APS workforce trends
- supporting statistics to the report
- unscheduled absence data.
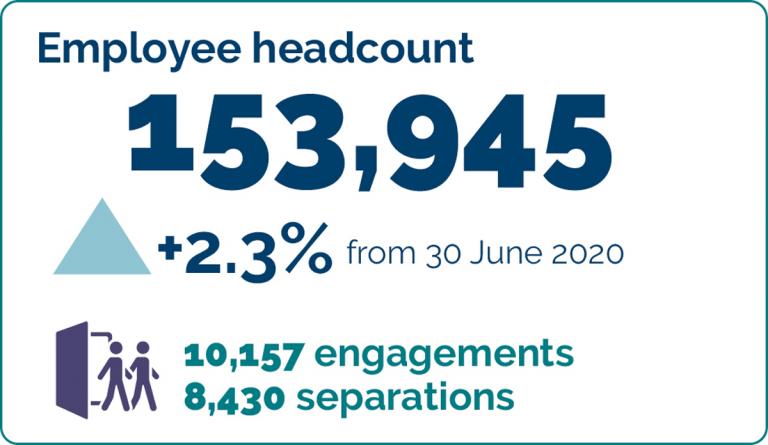
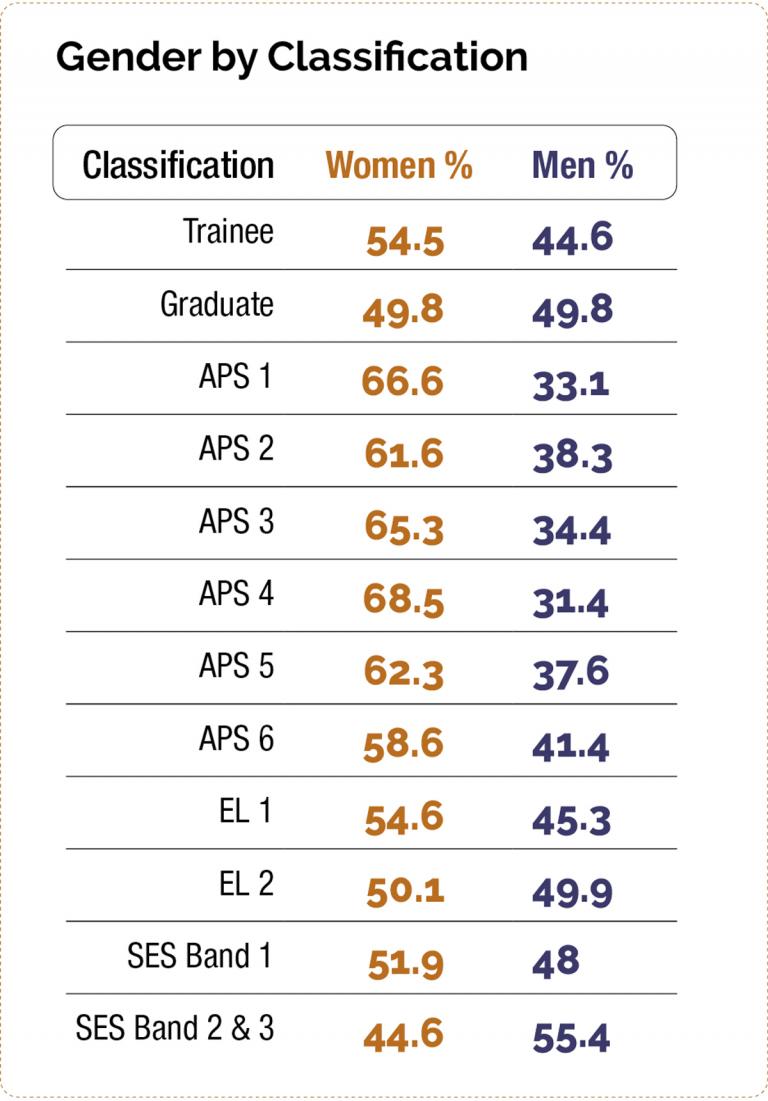
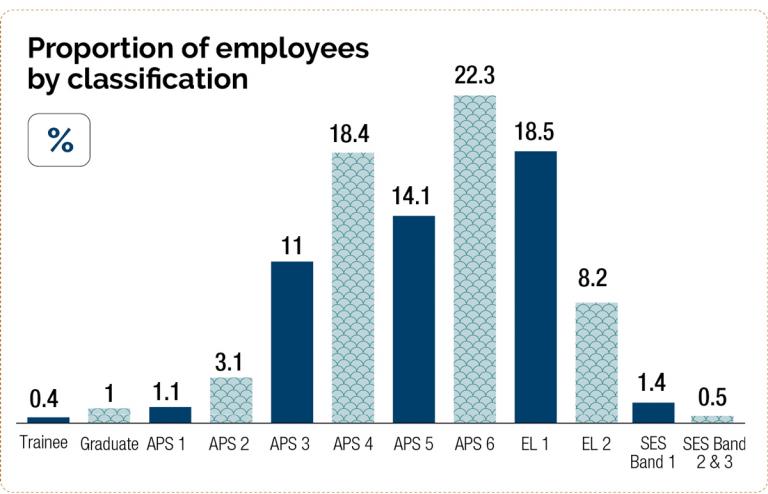
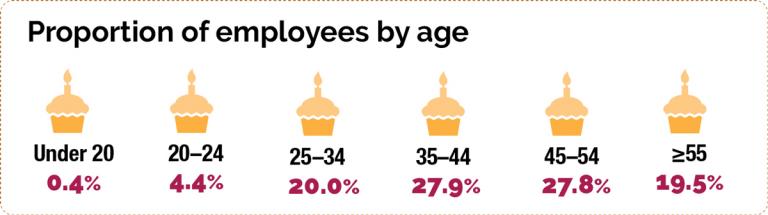
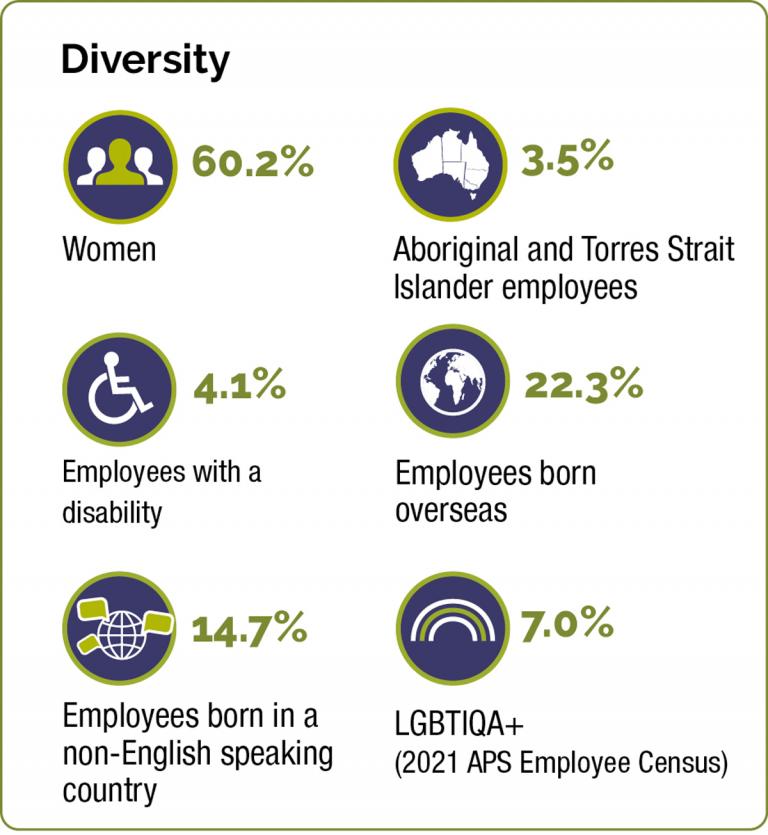
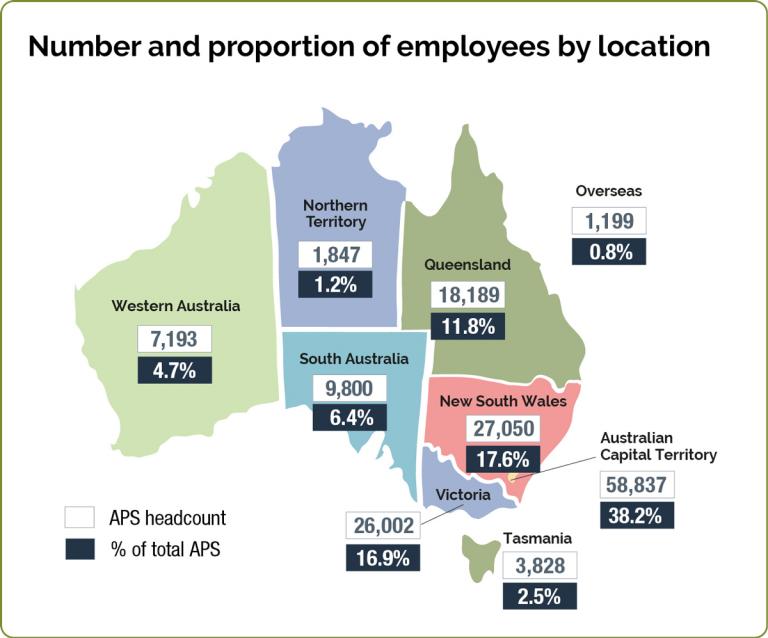
At a glance