Chapter 3: Your APS
The scale of the complexity we face, whether in managing our relationship with China, or in positioning Australia to prosper in a more unstable world, demands that we have our most dynamic, creative and talented people on the case. This means actively cultivating diverse and inclusive teams.89
Frances Adamson AC, then Secretary, Department of Foreign Affairs and Trade
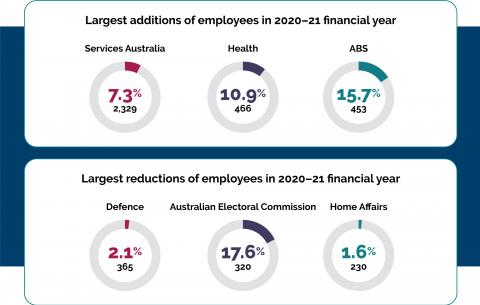
The APS operates in more than 567 locations across Australia and the globe. As at 30 June 2021, the APS employed 153,945 people across 97 agencies in 14 portfolios, an increase of 3,528 (2.3%) since 30 June 2020.90 APS employee numbers have fallen by 8% from their peak of 167,339 in June 2012.
Ongoing and non-ongoing employees
The number of ongoing employees at 30 June 2021 was 133,952, an increase of 1,730 (1.3%) from 30 June 2020. Ongoing employees make up 87% of the APS workforce, down slightly from 87.9% in 2020. This is the lowest proportion of ongoing employees in the APS over the last 20 years.
There were 19,993 non-ongoing APS employees at 30 June 2021, an increase of 1,798 (9.9%) from the previous year. This is the highest proportion of non-ongoing employees over the last 20 years.
This increase in non-ongoing employees reflects an increase in demand to assist the Government’s COVID-19 recovery plan, supporting jobs and providing essential services, including support payments, health and aged care. During this period, the ABS also required extra staff to prepare for the 2021 Census. As such, the agencies with the largest increase in non-ongoing employees during the last financial year were Services Australia (an increase of 2,952 non-ongoing employees) and the ABS (an increase of 409 non-ongoing employees).
Non-ongoing employees in the APS are employed for a specified term, or for the duration of a specified task, or to perform duties that are irregular or intermittent (casual). Of all non-ongoing employees at 30 June 2021:
- 11,469 (57.4%) were employed for a specified term or the duration of a specified task
- 8,524 (42.6%) were employed on a casual basis.
APS Staffing levels
The 2021–22 Federal Budget signalled an uplift in ASL resources across Commonwealth entities to support recovery from the pandemic. As a product of continued deliberate APS workforce planning, it is expected that over the medium and longer term there will be a modest increase in underlying ASL as the growth of the Australian population and economy recovers. As a result, the departmental funding provided to administer Government services will increase in 2021–22, which largely reflects an increase in service delivery operations. However, as a proportion of Government expenditure, departmental allocations continue to be lower than the average over the last 10 years.91
What we do and where we work
There is an enormous variety and diversity of roles, workplaces and locations for APS employees. The nature and scope of work varies between sections, branches, divisions and agencies located right across the globe.
Services Australia, the Department of Defence, the Australian Taxation Office and the Department of Home Affairs remain the 4 largest agencies, together employing 56% of the APS (86,071 employees). Similarly, Service Delivery continues to be the most common job family in the APS, with close to one-quarter of employees working in these types of roles.
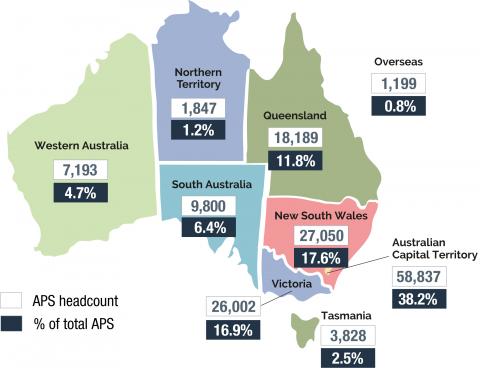
At 30 June 2021, 13.8% of APS employees were located in regions outside Australia’s capital cities. The growth in employee numbers outside capital cities has occurred mainly in New South Wales, which has the largest percentage of APS employees outside the Australian Capital Territory.
Figure 3.1: APS employee numbers by location (30 June 2021)
Diversity and inclusion
A diverse and inclusive APS contributes to better outcomes in service to the Government and the Australian community.
In 2021, the OECD noted Australia’s high performance on diversity and inclusion in the public service. Australia ranks 8th in the OECD for women in senior management and 9th on the development of a diverse workforce, and Australia’s central Government workforce is relatively younger (more employees aged 18 to 54 years) than the OECD average.92
APS leaders recognise that harnessing diversity in its many dimensions is a key element to agency success, especially when it comes to tackling problems of increasing complexity and on a global scale. Cultural diversity in the workplace, supported by an inclusive work environment, enables innovation, strong contestability and better outcomes.
Diversity and inclusion has often been perceived as a stand-alone effort undertaken by HR, or a ‘tick box’ exercise. However, there has been a considered effort across the APS over the last 12 months to ensure diversity and inclusion becomes embedded in everyday work, and that it is a part of workforce planning activities and good people management practices.
APS agencies host a wide range of employee or advocate networks to support people who identify with diversity groups in the workplace. The most common are Aboriginal and/or Torres Strait Islander employee networks (43 agencies), LGBTIQ+ employee networks (36 agencies), disability employee networks (33 agencies) and gender employee networks (33 agencies).93
APS agencies also collaborate to promote best practice and share lessons learned in workforce diversity and inclusion (70 agencies). For 1 in 3 agencies, this collaboration extends outside the APS to organisations such as the Diversity Network Australia, Diversity Council of Australia, Pride in Diversity, Science in Australia Gender Equity, Champions of Change Coalition, and the Australian Network on Disability.
Gender equality
Workplace gender equality is associated with increased organisational productivity and innovation, and improved attraction and retention of talent. According to the 2021 OECD Government at a Glance Report, Australia performs above the OECD average in terms of gender equality in public sector employment.94
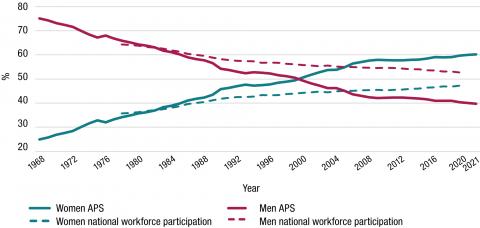
Proportionately, there are now more women in the APS (60.2%) than in the wider Australian labour market (47.6%).
Figure 3.2: Proportion of women and men in the APS (ongoing), compared with Australian workforce participation rate (1968 to 2021)
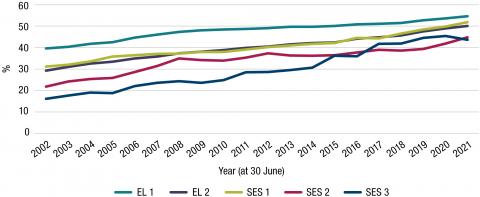
Women in the APS have reached, and in most cases exceeded, parity with men at every level up to and including the collective SES cohort. For the first time, women have achieved parity at the EL 2 (50.1%) and SES classifications (50.0%), although there is still a lower proportion of women at the individual SES 2 (44.8%) and SES 3 (43.7%) bands. For the past 8 years, the proportion of promotions into and within the SES for women has exceeded 50%, on average.95 In 2020–21, more women were promoted to the SES 1 (62.7%) and SES 2 (56.6%) bands than men, however, only 26.7% of promotions to the SES 3 band were women.
Figure 3.3: Proportion of women in mid to senior leadership roles EL 1 to SES 3 (2002 to 2021)
A renewed APS Gender Equality Strategy
To support the APS commitment to gender equality, the APSC, in partnership with the Office for Women, is renewing the APS Gender Equality Strategy.
The independent evaluation of the previous strategy, Balancing the Future: Australian Public Service Gender Equality Strategy 2016–19, found it had a positive impact on progressing gender equality across the APS. The evaluation noted that the APS cannot become complacent and must renew its energy to ensure that benefits of gender equality are shared by all both now and into the future.
The updated strategy will drive practical action for change by helping to shift gender norms, normalise flexible and respectful workplaces, and embed gender equality in all that the APS does.
It will strengthen APS approaches to preventing and responding to gender-based harassment and discrimination, sexual harassment, sexual assault and bullying.
Work on the strategy will be informed by the Australian Human Rights Commission’s Respect@Work report and the subsequent Government response, A Roadmap for Respect: Preventing and Addressing Sexual Harassment in Australian Workplaces.96
The APSC undertook extensive consultation to inform the strategy and will continue to engage with a wide range of stakeholders, including the Australian Human Rights Commission, state and territory Public Service Commissions and international partners, throughout its implementation.
The renewed strategy is expected to be released in late 2021.
In the APS, women are more likely to be working part-time (21.1%) compared with men (5.0%). This pattern is also reflected in the broader Australian labour market for June 2021, where 21.3% of women and 10.1% of men worked part-time.97
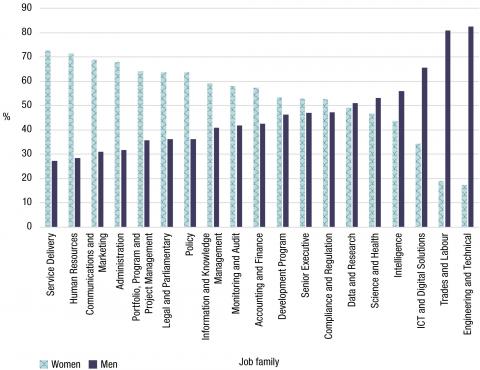
In the APS, almost two-thirds (63.7%) of non-ongoing roles are occupied by women. This is slightly higher than the proportion of women in ongoing roles (59.6%). According to APS job family data, more women work in service delivery (72.6%), HR (71.5%) and communications and marketing (68.8%) roles, and more men work in engineering and technical (82.6%), trades and labour (80.9%) and ICT and digital solutions (65.6%) roles.98
Figure 3.4: Proportion of job family by gender (30 June 2021)
Since 2014, respondents to the APS Employee Census could identify their gender as X (Indeterminate/Intersex/Unspecified). This question was reviewed in 2021 to align with the updated standard released by the ABS and to better provide employees the opportunity to more accurately reflect their situation.99 Respondents can now describe their gender as man or male, woman or female, non-binary or that they use a different term. In 2021, 0.3% described their gender as non-binary and another 0.2% said they use a different term.
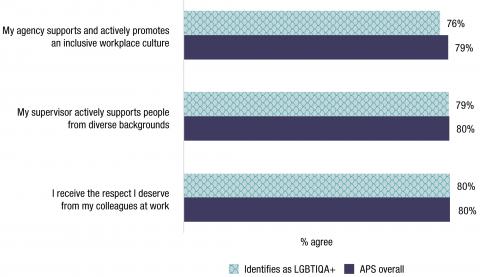
In 2021, 7% of APS Employee Census respondents identified as LGBTIQA+100, up from 4.1% in 2017. The majority of LGBTIQA+ respondents to the 2021 APS Employee Census perceive respect and inclusion in their workplaces.
Figure 3.5: Employees’ perceptions of an inclusive workplace culture (2021)
Connecting through pride in diversity
The Department of Agriculture, Water and the Environment’s (DAWE) LGBTIQ+ Pride Network has had an impactful first year. The network has grown to more than 170 members in all states across the nation.
A key network focus is recognising that its members are more than a gender and/or their sexuality. They are individuals with interests, backgrounds, and heritages that make them who they are. This is celebrated through the recognition of LGBTIQ+ days of significance, including the International Day Against Homophobia, Biphobia, Interphobia & Transphobia (IDAHOBIT) and the International Day of LGBTQIA+ People in STEM.
On International Non-Binary People’s Day, the Pride Network released the educational video, Supporting non-binary people. The video, developed with the DAWE’s Learning and Development team, explains what non-binary means, and how to support non-binary people through acceptance, support and the use of inclusive language.
The Pride Network is leading work on promoting the importance, visibility and access to allies not only for LGBTIQ+ people but for all people in DAWE. This leadership extends to active participation in the APS Pride Champions Network, giving departments and agencies the opportunity to connect with the Pride Network for support through events and materials for LGBTIQ+ people and their allies.
Aboriginal and/or Torres Strait Islander employees
My view on this is that the only way to cement changes, and it’s a slow way, but it’s one person at a time. And every single person has to be involved in our reconciliation journey, and they have to do it through the contacts they make, the way they talk, the way they interact, the way they listen. It’s not just learning about Indigenous culture, it’s about how different cultural perspectives knit together … in our workplace, we’re well down that reconciliation path. And as we go out into the broader community, we hopefully take that with us.101
Ray Griggs AO CSC, then Chief Executive Officer, National Indigenous Australians Agency
As employers, all Commonwealth agencies have a responsibility to contribute to Australia’s Closing the Gap priorities, especially around strong Aboriginal and/or Torres Strait Islander workforce participation. In fulfilling this responsibility, the APS is well placed to support Aboriginal and/or Torres Strait Islander employees through career development, retention and advancement. There are also significant benefits to agencies and the broader public service from this approach. Workplace environments that demonstrate cultural integrity drive better policy development and service delivery outcomes to meet the needs of the Australian community. Benefits of increased Aboriginal and/or Torres Strait Islander representation include increased diversity of employee experience and opinion, and improved connection to Indigenous communities.
The APS has committed to a range of programs and measures designed to increase the number of Aboriginal and/or Torres Strait Islander people in the service. APS agencies are encouraged to increase their use of Affirmative Measures Indigenous recruitment, and the APS has also run dedicated Indigenous graduate and internship programs for several years.
Implementation deliverables of the Commonwealth Aboriginal and Torres Strait Islander Workforce Strategy 2020–2024 include a review of Aboriginal and/or Torres Strait Islander-specific entry level programs and an expansion of the Indigenous Graduate Pathway.102 In consultation with other APS agencies, the APSC is developing an Aboriginal and/or Torres Strait Islander-specific Employee Value Proposition.
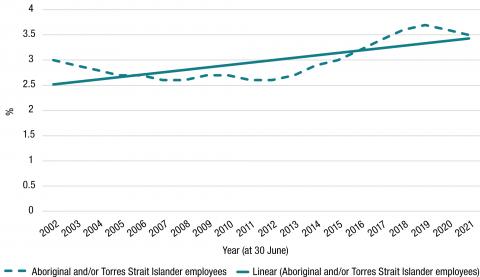
The proportion of Aboriginal and/or Torres Strait Islander employees in the APS has steadily increased over time, from 2.6% in 2012 to 3.5% in 2021.103 However, overall representation has remained steady in the past couple of years. A slightly higher proportion of respondents to the anonymous 2021 APS Employee Census (3.8%) identify as an Australian Aboriginal and/or Torres Strait Islander person.
Figure 3.6: Proportion of Aboriginal and/or Torres Strait Islander employees (2002 to 2021)
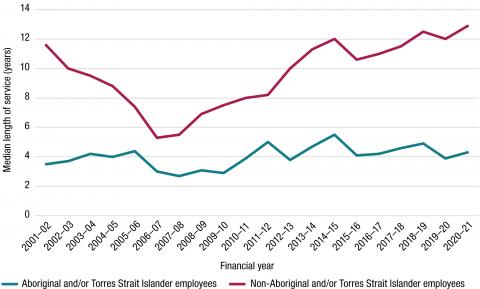
Annual engagement rates (as a proportion of all Aboriginal and/or Torres Strait Islander employees) are high, at around 13% on average over the past 2 decades (compared with 7% for non-Aboriginal and/or Torres Strait Islander employees). However, Aboriginal and/or Torres Strait Islander employees only stay in the service for a median 4.3 years compared with 12.9 years for non-Aboriginal and/or Torres Strait Islander employees. The separation rate is also higher for Aboriginal and/or Torres Strait Islander employees – 8.3% left the APS within the past year compared with 6.2% of non-Aboriginal and/or Torres Strait Islander employees.104
To address this, the Commonwealth Aboriginal and Torres Strait Islander Workforce Strategy includes several deliverables focused on retention of Aboriginal and/or Torres Strait Islander employees. These deliverables will be evaluated iteratively throughout the life of the strategy and adjusted as required.
One of these deliverables is about supporting agencies to improve the cultural capability of their non-Indigenous staff. Understanding that agencies are at varying levels of maturity for cultural capability, the strategy identifies different action items agencies can undertake to improve and embed understanding of Aboriginal and/or Torres Strait Islander cultures in the workplace. The strategy also specifically references the need for agencies to have Reconciliation Action Plans as a mechanism for supporting the development of culturally safe workspaces and services. Work is continuing across the service, with two-thirds of APS agencies now having Reconciliation Action Plans in place.105
The strategy’s workforce representation targets are also designed to build and progress a talent pipeline. This includes developing employees within the public sector to enable promotion into the more senior roles and decreasing the relative separation rates of Aboriginal and/or Torres Strait Islander employees. Two of the strategy’s core focus areas support the progression of Aboriginal and/or Torres Strait Islander employees. Action items under Career advancement and development and Career pathways aim to diversify and strengthen pathways and development opportunities.
Figure 3.7: Net engagement, Aboriginal and/or Torres Strait Islander employees and non-Aboriginal and/or Torres Strait Islander employees (2002 to 2021)
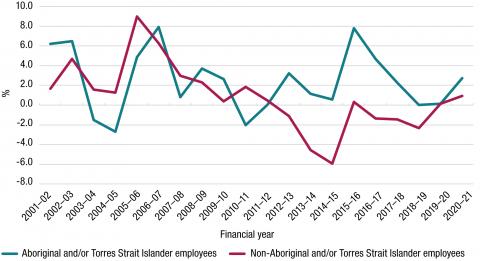
Figure 3.8: Median length of service at separation, Aboriginal and/or Torres Strait Islander employees and non-Aboriginal and/or Torres Strait Islander employees (2001–02 to 2020–21)
Preserving Aboriginal and/or Torres Strait Islander languages for future generations
When Doug Marmion took up a teaching role in Alice Springs in 1983, he was not familiar with any of the distinct Aboriginal and/or Torres Strait Islander languages spoken across the country. Doug’s young students shared the Pitjantjatjara language with him through songs and stories. Doug’s interest soon found him completing Honours in Linguistics and working at the Yamaji Language Centre in Geraldton, Western Australia.
“My work focused on collecting language and cultural information from the elderly speakers of the Geraldton area,” says Doug. “I became close to many of the elders who were among the last speakers of their languages, and it was a privilege to be able to work with them.”
Dr Doug Marmion PSM
As a Research Fellow at the Australian Institute of Aboriginal and Torres Strait Islander Studies (AIATSIS), Doug has worked on the maintenance and revival of Aboriginal and Torres Strait Islander languages. This includes developing AUSTLANG, a definitive thesaurus and online database of Aboriginal and/or Torres Strait Islander languages. The database has become the world authoritative standard and contains more than 1,200 records of language varieties. Doug’s work was recognised in 2021 with a Public Service Medal.
Doug is particularly proud of his work to reawaken the endangered Ngunnawal language. The Ngunnawal Language Revival Project brought together AIATSIS linguists with members of the Ngunnawal community to develop a suitable writing system and initiate early development of school lessons in the language.
‘It was amazing to see the change in people as they learnt more about their language and culture. It was a profound and powerful experience for them,’ he says.
Doug has led engagement with Australian Government ministers, the Governor-General and senior APS executives, coaching them to embed Aboriginal and/or Torres Strait Islander acknowledgements into APS protocols.
Disability
In Australia, the number of people living with disability is estimated to be 1 in 6, or about 4.4 million people. Around 48% of people aged 15 to 64 with disability are employed.106 This is far lower than those without disability (80%). The unemployment rate for people with disability has risen from 8% in 2003 to 10% in 2019, while the rate for people without disability has remained steady.107
With 4.4 million people in Australia identifying as having a disability, improving the representation of people with disability is vital to building a [APS] workforce that better reflects the diversity of the Australian community we serve.108
Kathryn Campbell AO CSC, Secretary, Department of Foreign Affairs and Trade, and former Secretary of the Department of Social Services
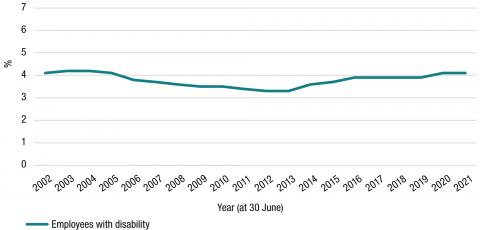
In the 2021 APS Employee Census, 9.3% of employees reported having a disability, an increase from 8.5% in 2020.109 The proportion of APS employees who identify as having an ongoing disability in their agencies’ HR systems is lower at 4.1%. This figure may be underreported due to a number of factors. An employee who does not require workplace adjustments may see no value in disclosure on a formal HR system. Employees who acquire a disability after they have been employed may not update their details in agency records. Alternatively, employees with a disability may only feel comfortable disclosing this information anonymously in the APS Employee Census due to concerns about the impact on their employment or because of previous negative experiences with disclosure.
Agencies that employ a high proportion of employees identifying as having a disability are the National Disability Insurance Agency (10.8%), the APSC (8.4%), Safe Work Australia (8.3%), and the NDIS Quality and Safeguards Commission (7.6%).110
Figure 3.9: Proportion of APS employees with disability (2002 to 2021)
At 30 June 2021, the classification distribution of employees with disability largely mirrored that of employees without disability, with the exception of APS 3–4 and EL classifications. At the APS 3–4 classifications, employees with disability are in greater relative proportion than employees without disability, while at the Executive Level the reverse is true. This difference may be explained by the high proportion of employees with disability working in service delivery where most roles are at the APS 3–4 classifications.
Figure 3.10: Classification by disability status (30 June 2021)
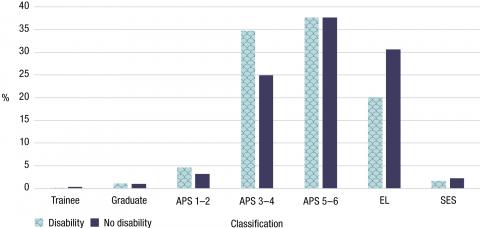
Figure 3.11: Retention rate of APS employees with and without disability (2002–03 to 2020–21)
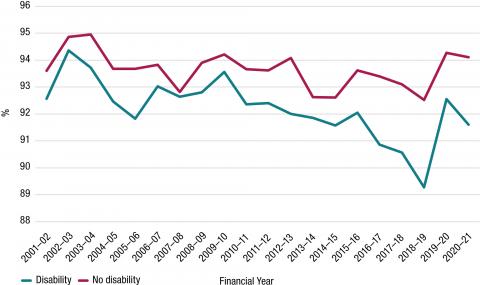
Over the last 20 years, employees with disability have consistently had a lower retention rate than employees without disability. The APS Disability Employment Strategy 2020–25, launched in December 2020, was developed to address this and other challenges facing employees with a disability.111 The strategy was developed in partnership with the Department of Social Services following extensive consultation with stakeholders including the Disability Discrimination Commissioner, Dr Ben Gauntlett, the Australian Human Rights Commission, those with lived experience of disability, and APS agencies and staff.
The strategy focuses on ways to attract, recruit and retain more people with disability into the APS, and to create accessible and inclusive workplace cultures and environments. It includes a 7% employment target for people with disability in the APS by 2025. This reflects the Government’s commitment (announced May 2019) of 7% of disability employment in the APS.
Implementation of the practical actions in the strategy, along with existing agency-led initiatives, will support improved employment outcomes for people with disability in the APS. While Affirmative Measures recruitment rounds and Recruitability continue to be used widely by agencies to attract talented people with disability, there will be a focus on strengthening their effectiveness and better supporting their use in agencies. Along with Affirmative Measures rounds, agencies have developed specific programs and partnerships to improve the representation of people with disability in the APS. Examples include Services Australia’s Dandelion Program,112 the Department of Defence’s collaboration with WithYouWithMe113 and the Ability Apprenticeship Program114 in the Department of Social Services.
The APS remains committed to ensuring that, once recruited, employees with disability are well supported and provided with career development opportunities. APS Disability Champions and staff networks within agencies continue to drive actions in the strategy, such as the establishment of disability contact officers and the review of the accessibility of APS workplaces.
An interim evaluation of the strategy will be undertaken in 2022, with a final evaluation in 2025.
The most accessible Australian Census in history
The Australian Bureau of Statistics (ABS) has delivered the most accessible Australian Census ever. Teresa Dickinson, Senior Responsible Officer for the 2021 Census, explained that “Everyone plays their part in helping paint a picture of the economic, social and cultural make up of Australia and so it is important that everyone is able to participate easily.”
‘For example, 83 Auslan video guides were available to provide supporting information for the deaf community about each question on the Census form. All video content included closed captioning and transcripts. A range of services were provided for people who are blind or have low vision, including Braille and large print Census forms, and audio grabs for each of the questions. Census information was also translated into 48 different languages, including 19 Indigenous languages.’
The 2021 Census website was developed following the Digital Transformation Agency’s Digital Service Standard and was designed to meet the Australian Government’s web accessibility requirements and the World Wide Web Consortium’s Web Content Accessibility Guidelines version 2.0 at the AA level. The website included new features that enabled people to participate without the use of special codes or letters from the ABS. The design was informed by extensive testing with members of the public, including those using assistive technologies. The 2021 Census website included a link to the National Relay Service and Translating and Interpreting Service to make it easier for people to receive assistance.
Dr David Gruen, Australian Statistician, was mindful of the importance of the 2021 Census in the context of what has been happening globally and locally. “The Census will provide further insights into the impacts of COVID-19 across the Australian population,” says Dr Gruen.
“We need everyone to be counted to tell the story of how Australia has changed and to plan for the future. As always, the Census will provide invaluable information including at the local level that governments, businesses, communities, and individuals can trust to make important decisions.”115
Culturally and linguistically diverse
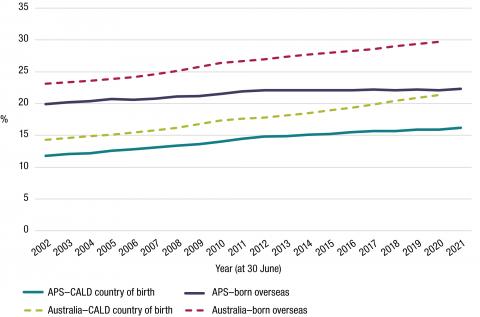
Culturally and linguistically diverse (CALD) groups describe those who were born overseas, have a parent born overseas or speak a variety of languages.116 In Australia in 2020, 29.8% of Australians were born overseas and 21.3% were from a non-English speaking country.117 At 30 June 2021, 22.3% of APS employees were born overseas with 16.2% from non-English speaking countries.
Since 2002, there has been an increase in the proportion of APS employees born overseas, especially those coming from non-English speaking countries.
Figure 3.12: Proportion of culturally and linguistically diverse employees, APS and Australia (2002 to 2021)
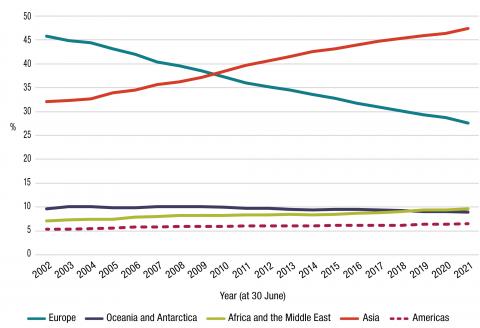
In 2020–21, of those APS employees born overseas, most were born in either Asia (47.4%) or Europe (27.6%). Other regions make up less than 10% each and have only changed marginally over the last 20 years. Compared with the Australian population, the proportion of APS employees born in Asia is relatively higher while all other regions have a slightly lower representation.
Figure 3.13: Region of birth for APS employees born overseas (2002 to 2021)
At June 2021, the proportion of APS employees whose first language was ‘English only’ has dropped from 82.1% in 2002 to 77.3% in 2021. In contrast, APS employees who first spoke ‘English and another language’ has increased from 7.2% in 2002 to 12.1% in 2021. Over the last 20 years, the proportion of APS employees who did not speak English as a first language has remained relatively stable at around 10.6%. Of employees who first spoke a language other than English119, the most commonly spoken first languages were Vietnamese (5.8%), Italian (5.7%) and Chinese (5.5%).
While there is not currently a whole-of-APS strategy for employees from CALD backgrounds, work is being done in the APS to strengthen diversity and inclusion that will benefit this cohort. Recent feedback from a range of APS agencies provided insight into how agencies are positively contributing by:
- exploring innovative ways to work more effectively across international programs, including leveraging locally-engaged staff knowledge on cultural issues
- promoting diversity in specific areas, such as in National Security/Terrorism, where CALD perspectives can provide valuable insights
- promoting mentorship, networks, exchange programs and training for CALD staff and managers to support the retention and promotion of CALD staff
- hosting events to celebrate significant occasions such as Lunar New Year and Ramadan— these events provide opportunities to discuss issues facing CALD communities and foster greater inclusion and diversity
- creating ‘CALD Officer’ roles to provide guidance and troubleshooting for all staff to create a more inclusive culture.
National Library of Australia goes digital to celebrate Pacific Island cultures
Libraries, museums, galleries, archives and other cultural heritage organisations have within their collections items and records about the people of the Pacific Islands. It is estimated there are over half a million cultural heritage objects from the Pacific Islands held in more than 650 cultural institutions around the globe.
A pilot project brought together representatives from the Pacific Islander communities, the National Library of Australia, National Library of New Zealand and Department of Foreign Affairs and Trade to co-design and deliver the site, www.digitalpasifik.org.
The goal was to empower people in and of the Pacific Islands, enabling them to see, discover and explore items of digitised cultural heritage that are held in collections around the world.
Since its launch in November 2020, the website has been connecting people living across the Pacific Ocean, and those living far from the Pacific, with the histories and cultures of their communities. The cultural heritage of the Pacific Islands is a lived one, brought alive by storytelling and knowledge passed on.
The website was designed by, with and for Pacific peoples, educators, learners and researchers. Communities are using it to connect and contribute to records of traditional knowledge, as an academic and research resource, and an educational resource. It is funded by the Australian Department of Foreign Affairs and Trade, and administered by the National Library of New Zealand.
The co-design approach ensures content is presented within a cultural heritage framework that considers cultural and intellectual property protocols, ethical issues and cultural sensitivities. The project actively seeks to honour the work that has been done and is underway within the cultural heritage sector. All Australian collections are provided in a single and combined Australian feed via Trove, an initiative of the National Library of Australia that brings together online the collections of hundreds of organisations from around Australia. Using Trove saved time, money and effort, and enabled teams across the Pacific to work remotely—united in their goal to share their culture online.
Multi-generational
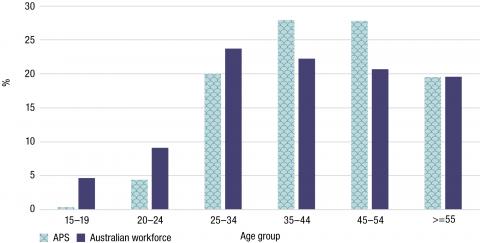
Australia’s population and the APS workforce are ageing.120 At 30 June 2021, the average age of APS employees was 43.5 years, increasing steadily from 40.2 years in 2002. This is in line with the trends in ageing across the general Australian workforce.
The proportion of the APS population that is 50 years or older has increased from 20.8% in 2002 to 33% in 2021. At 30 June 2021, 8.5% of APS employees were aged 60 years and over. The number of employees under the age of 30 has declined from 17.9% in 2002 to 13.7% in 2021.
Figure 3.14: Age distribution comparison between APS and Australian workforce (30 June 2021)
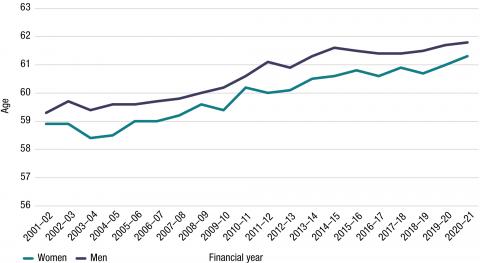
The APS does not have a maximum retirement age; employees choose when to retire. The average retirement age within the APS has been increasing over time, from 59.4 years of age in 2001–02, to 61.5 in 2020–21. This remains higher than the national average retirement age of 55.4 years in 2018–19.121
Figure 3.15: APS average retirement age by gender (2001–02 to 2020–21)
While overall the trend is toward an ageing workforce, the APS workforce is also becoming more age-diverse. People are working longer and employee expectations are changing. Access to flexible work is and will continue to be a core component of enabling an APS workforce that now stretches across 4 generations. Building a multigenerational workplace where all employees can equally access resources, support and opportunities is important to ensure the public service performs at its best.
Through the Government’s Delivering for Australians reform agenda, the APS is working to ensure it does more to retain and recruit older Australians. A Mature Age Action Plan specifically targeting mature age workers, defined by the ABS as those aged 45 years or over122, will be released in late 2021. The Plan will provide a range of practical actions to build an APS workplace that embraces and supports an age-inclusive, multigenerational public service.
89Frances Adamson AC, then Secretary, Department of Foreign Affairs and Trade. (2021). National Press Club Address. 23 June.
90See Appendix 2 for a full list as at 30 June 2021.
91Commonwealth of Australia. (2021). Agency Resourcing: Budget Paper No. 4 2021–22. 11 May.
92OECD. (2021). Government at a Glance 2021 Country Fact Sheet: Australia. 9 July.
932021 Agency Survey. A total of 95 agencies responded to the 2021 Agency Survey.
94OECD. (2021). Government at a Glance 2021 Country Fact Sheet: Australia. 9 July.
95Promotions, as opposed to new hires, account for around 70% of new SES employees.
96Attorney-General’s Department. (2021). A Roadmap for Respect: Preventing and Addressing Sexual Harassment in Australian Workplaces. 8 April.
97ABS. (2021). Labour Force, Australia. 14 October. Part-time employment is defined as less than 35 hours of work a week.
98See Appendix 3 for more information on APS job family data.
99 ABS. (2021). Standard for Sex, Gender, Variations of Sex Characteristics and Sexual Orientation Variables. 14 January.
100Lesbian, Gay, Bisexual, Transgender and/or gender diverse, Intersex, Queer, Questioning and/or Asexual.
101Ray Griggs AO CSC, then Chief Executive Officer, National Indigenous Australians Agency. (2020). IPAA Work with Purpose Podcast Episode #14. 6 July.
102APSC. (2020). Commonwealth Aboriginal and Torres Strait Islander Workforce Strategy 2020-2024. 3 July.
103APSED.
104APSED.
1052021 APS Agency Survey.
106Australian Institute of Health and Welfare. (2020). People with disability in Australia. 2 October.
107Australian Institute of Health and Welfare. (2019). People with disability in Australia 2019: in brief. 3 September.
108 APSC. (2020). Australian Public Service Disability Employment Strategy 2020-25. 3 December.
109The definition of ‘disability’ used in the APS is based on the Australian Bureau of Statistics’ Survey of Disability, Ageing and Carers. More information is available at: APSC. (2019). Definition of disability. 9 September.
110At 30 June 2021.
111APSC. (2020). Australian Public Service Disability Employment Strategy 2020-25. 3 December.
112Autism Spectrum Australia Launchpad. (2020). The Dandelion Program - Specialisterne Australia. 18 September.
113WithYouWithMe. (2021). WithYouWithMe: For Government. n.d.
114 DSS. (2021). Ability Apprenticeship Program. 12 October.
115Dr David Gruen, Australian Statistician and Head of Data Profession. (2021). 2021 Census Press Conference. 18 June.
116Country of birth, first language spoken, mother’s and father’s first language, language spoken at home and year of arrival in Australia data elements are collected in the APSED. The ABS defines the CALD population mainly by country of birth, language spoken at home, self-reported English proficiency, or other characteristics including year of arrival in Australia, parents’ country of birth and religious affiliation. The APSC is currently reviewing its data collection to move towards metrics that more closely align with the CALD metrics used by the ABS. More information is available at: ABS. (1999). Standards for Statistics on Cultural and Language Diversity, 1999 (ABS cat. no. 1289.0). 22 November.
117ABS. (2021). Migration, Australia. 23 April.
118A CALD country is defined as a country that is not in the list of Main English-Speaking Countries as described by the ABS. More information is available at: ABS. (2020). Migrant Data Matrices. 22 December.
119This includes employees who first spoke another language in addition to English.
120ABS. (2018). Population Projections, Australia (2017 (base) – 2066. 22 November.
121ABS. (2020). Retirement and Retirement Intentions, Australia. 8 May.
122ABS. (2008). Health of mature age workers in Australia: a snapshot 2004–2005. 29 July.


