Movement of Employees
Each year a large number of employees move into and within the APS. These movements are calculated over a full calendar year rather than at a point in time. During the 2020 calendar year there were 25,397 movements consisting:
- 9,262 people engaged as ongoing employees
- 11,606 current employees promoted within their agency
- 976 current employees promoted to another APS agency
- 2,649 employees transferred permanently to another APS agency
- 904 employees temporarily transferred to another APS agency.
These movements equate to 19.4% of ongoing staff taking up initial employment, changing jobs or being promoted within the APS in the year to 31 December 2020. The true mobility of the APS is however higher and includes internal moves within each agency. APSED data does not include movements at-level within agencies, or secondments among agencies.
Engagements of ongoing employees into the APS increased by 6.3% (9,262 new employees) in 2020, compared to December 2019, which saw 8,709 new employees. Since 2001, trends in engagements have fluctuated from 2,704 during the recruitment freeze in 2014–2015 to a peak of 19,446 in the 2007 calendar year (APSED December 2020 Table 50).
Most engagements during the 2020 calendar year were at the APS 6 (17.7%), APS 3 (16.0%), APS 4 (14.5%), and APS 5 (14.2%) levels (APSED December 2020 Table 51).
Approximately 42.4% of people engaged as ongoing employees were under the age of 30 years compared to just 10.1% of the ongoing APS workforce (APSED December 2020 Table 41 and APSED December 2020 Table 50).
Multi-agency experience
The majority of ongoing APS employees have only worked in one agency. At 31 December 2020, 69.2% of ongoing APS employees had only worked in one agency, 19.0% in two agencies and 11.8% in three or more agencies (APSED December 2020 Table 45).
The proportion of APS employees with multi-agency experience varied based on some key demographics. For example, ongoing employees who have worked in multiple agencies are:
- In relatively senior roles, including 64.0% of SES and 44.3% of EL
- Located in the Australian Capital Territory — 47.1%
- Working in micro agencies of 20 staff or fewer — 75.4%
- Working in policy agencies — 53.8%.
The drivers behind these variables are likely related. Most policy agencies are located within the Australian Capital Territory, which affects the mobility rates behind both location and agency type. Seniority is linked to tenure in the APS. The median length of service of SES is 18.9 years, affording them a greater opportunity to work across multiple agencies.
Movements between agencies and temporary transfers
As a whole, permanent and temporary transfer movements between agencies are normally a relatively small part of the mobility picture across the APS. In the 2020 calendar year, a total of 4,529 or 3.5% of ongoing employees moved to another agency within the APS either by a permanent move, as a promotion, or as a temporary transfer. Over the past 20 years, this rate has remained steady, fluctuating between 1.5% and 3.9%.
Over the 2020 calendar year, the APS mobilised to support priority areas in response to the bushfire and the COVID-19 pandemic. The 2020 employee census reports over 2500 employees were deployed to other agencies to support service delivery and other priority functions. These deployments occurred predominantly through secondment arrangements between agencies, whereby employees continue to operate under their home agency enterprise agreements. These secondments are not captured in APSED.
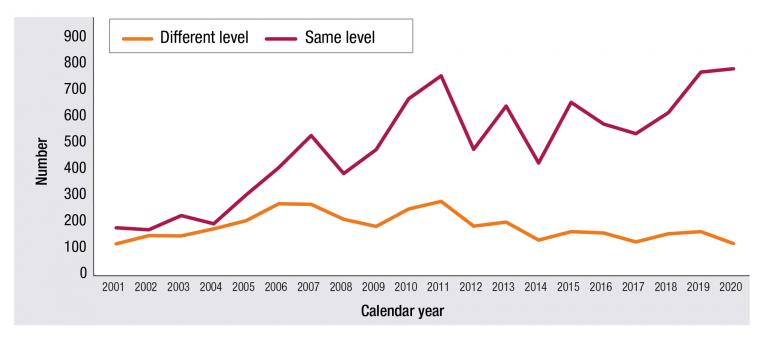
During the 2020 calendar year, there were 904 temporary transfers across the APS, which represented 3.6% of all movements recorded through APSED, which was a decrease of 32 from the 2019 calendar year (Figure 4.1).
A temporary transfer is the movement of an APS employee to another APS agency, at any level, for a specified period with the intention that the employee will return to their home agency.
A majority of temporary transfers to another APS agency were at the same classification level. Since the 2009 calendar year, the proportion of temporary transfers at the same classification level ranged from 72.1% to 86.7%. In contrast, between the 2001 and 2004 financial years there was little difference in the number of temporary transfers at level and higher duties.
Figure 4.1: Temporary transfer at level or with higher duties, 2001 to 2020

Length of temporary transfer
The median length of time employees go on temporary transfer to another agency is approximately six months. This is a consistent trend over the last 15 years. Since 2000, around 37% of employees who went on temporary transfer ended up moving permanently to that agency within six months of the temporary transfer ending.
Separations
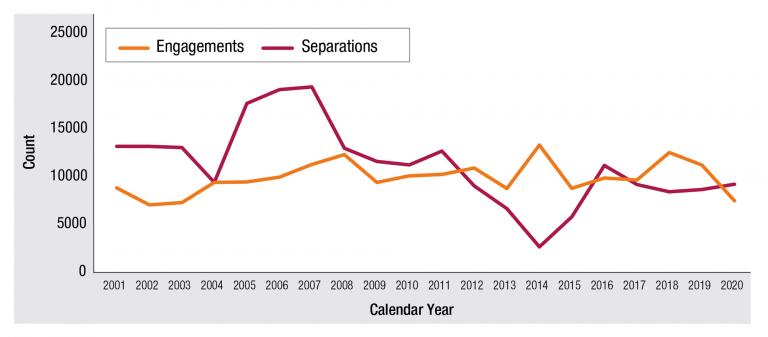
Employees separate from the APS through a number of mechanisms including resignations, termination of employment, retrenchment, age retirement, physical or mental incapacity, death or compulsory movement to a non-APS agency. During the 2020 calendar year, there were 7,541 separations of ongoing employees, a drop of 3,730 (or 33.1%) from 2019. This is the lowest number of separations since 2003. Compared to the previous year, there were 1052 fewer resignations and 867 fewer redundancies during 2020. Unlike engagements, separations have remained relatively stable over time, fluctuating between approximately 7,000 and 13,000 employees per year (Figure 4.2). It must also be noted that the number of separations in 2019 included 1,685 employees from the Australian Securities and Investments Commission who left coverage of the APS on the 1st July 2019.
Figure 4.2: Comparison of Engagements and Separations, 31 December 2001 – 31 December 2020

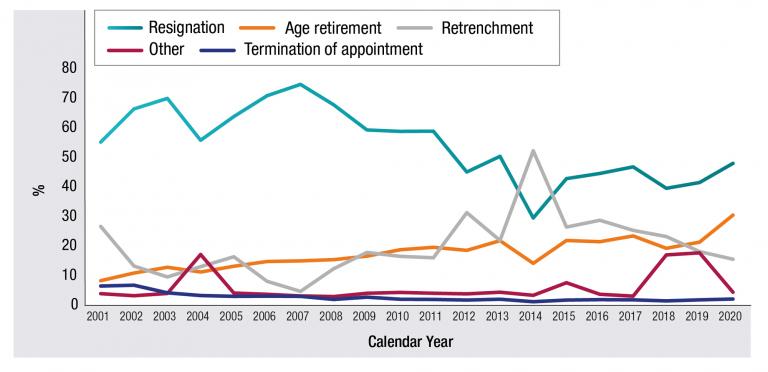
Resignations are consistently the most common separation type, and comprised 47.9% of all separations over the 2020 calendar year. Age retirements were the second highest separation type across the APS making up 30.4%. Age retirements have continued to increase as a proportion of all separations since 2001. The proportion of age retirements during 2020 was the highest over the last twenty years and is indicative of an ageing APS population.
Trend data indicates the close relationship between the numbers of resignations and retrenchments. Generally, resignations fall as the number of retrenchments rise. The exception to this trend can be seen in the 2018 and 2019 calendar years where some agencies compulsorily transferred to non-APS agencies, reflected as ‘other’ in Figure 4.3. This had an impact on the proportional representation of resignations and retrenchments.
Retrenchments are the third most common separation type with 15.4% over the 2020 calendar year. This has declined from 18.0% in the 2019 calendar year and is the lowest proportion of separations since the 2008 calendar year (APSED December 2020 Table 65).
Figure 4.3: Separations by type, 31 December 2001– 31 December 2020


