Chapter 3: Base Salary
Base Salary is an employee’s full time equivalent annualised salary. It includes salary sacrifice amounts such as pre-tax employee superannuation contributions made via salary sacrifice arrangements. It excludes bonuses and other benefits.
The weighted Base Salary median increase from 2018 to 2019 was 1.2% for the whole of APS, which reflects weighted increases of 1.1% for non-SES employees and 3.4% for SES.
The median increase in Base Salary across all classifications was 3.7% from 2018 to 2019 (Table 3.1).
The greatest increase in median Base Salary was at the Graduate classification level with a 5.4% increase. The lowest median movement was the APS 1 classification which decreased by 1.9%.
Most APS and EL classifications increased between 1% and 1.3%. The most substantial influence on non-SES Base Salaries in 2019 was the frontloading of wage increases in enterprise agreements that commenced in 2017. Australian Government policy allows for enterprise agreements to provide general wage increases averaging up to 2% per annum over three years. The majority of agencies that had an enterprise agreement commencing in 2017 provided for wage increases of 5%, of a total 6%, within the first two years. This included the three largest agencies, Services Australia, the Department of Defence and the Australian Taxation Office. Further, employees in the Department of Home Affairs (another large agency) did not receive a wage increase in 2019. (These employees received a wage increase in June 2018 and February 2020 through a Workplace Determination established by the Fair Work Commission.) These factors resulted in general wage increases of 1% (or less) for the majority of non-SES employees in 2019.
SES median Base Salaries increased between 3.2% and 3.5% in 2019. The factors contributing to increases in SES Base Salaries include, but are not limited to, the following:
- A continued move to roll motor vehicle related allowances into Base Salary for some employees. In 2019 the proportion of SES employees receiving a motor vehicle related allowance continued to decrease, dropping by approximately 10% from the previous year. This trend suggests a repackaging of motor vehicle related allowances into Base Salary for SES employees. This is supported by the fact that Base Salary movement for all SES classifications has been higher than movement in Total Remuneration Package and Total Reward. A similar pattern occurred in 2018 where the weighted SES Base Salary increase (3.8%) was much higher than increases in other remuneration components. Since 2017 the proportion of SES receiving a motor vehicle related allowance has dropped from 70% to 50% of SES employees.
- Increases in numbers of SES employees at agencies paying above the APS median relative to agencies paying below the median.
- Most SES are employed under individual workplace arrangements that are negotiated between the agency and the employee.
- Agencies have different remuneration policy frameworks. For example, some agencies have increment structures for the SES, while others do not.
|
P5 |
Q1 |
Median |
% change |
Q3 |
P95 |
||||||
|---|---|---|---|---|---|---|---|---|---|---|---|
|
2018 |
2019 |
2018 |
2019 |
2018 |
2019 |
2018 |
2019 |
2018 |
2019 |
||
|
Grad. |
$59,376 |
$59,970 |
$60,013 |
$61,825 |
$63,030 |
$66,443 |
5.4% |
$66,436 |
$67,190 |
$69,331 |
$73,086 |
|
APS 1 |
$40,625 |
$43,468 |
$45,402 |
$44,313 |
$49,460 |
$48,521 |
-1.9% |
$50,989 |
$51,499 |
$52,256 |
$53,052 |
|
APS 2 |
$49,321 |
$50,842 |
$53,783 |
$55,805 |
$56,694 |
$57,925 |
2.2% |
$57,884 |
$58,463 |
$59,606 |
$60,202 |
|
APS 3 |
$58,322 |
$57,777 |
$62,192 |
$63,010 |
$63,952 |
$64,799 |
1.3% |
$65,655 |
$66,312 |
$66,041 |
$66,701 |
|
APS 4 |
$65,656 |
$66,313 |
$69,580 |
$69,711 |
$72,531 |
$73,256 |
1.0% |
$72,744 |
$73,472 |
$74,008 |
$74,748 |
|
APS 5 |
$72,686 |
$73,413 |
$75,770 |
$76,040 |
$78,092 |
$78,873 |
1.0% |
$79,365 |
$80,674 |
$80,987 |
$82,443 |
|
APS 6 |
$81,176 |
$82,219 |
$88,713 |
$89,915 |
$91,238 |
$92,150 |
1.0% |
$93,732 |
$94,670 |
$95,809 |
$97,725 |
|
EL 1 |
$104,177 |
$104,228 |
$110,014 |
$111,595 |
$113,866 |
$115,005 |
1.0% |
$114,624 |
$116,871 |
$121,860 |
$122,855 |
|
EL 2 |
$123,872 |
$126,041 |
$135,939 |
$137,242 |
$140,680 |
$142,556 |
1.3% |
$144,912 |
$147,250 |
$158,743 |
$160,330 |
|
SES 1 |
$168,861 |
$171,917 |
$187,276 |
$192,085 |
$196,609 |
$202,910 |
3.2% |
$212,948 |
$218,775 |
$233,094 |
$240,045 |
|
SES 2 |
$215,001 |
$223,981 |
$237,786 |
$244,065 |
$256,491 |
$265,091 |
3.4% |
$272,647 |
$283,460 |
$298,762 |
$306,686 |
|
SES 3 |
$304,918 |
$303,539 |
$330,203 |
$336,738 |
$350,000 |
$362,100 |
3.5% |
$378,905 |
$387,350 |
$424,066 |
$441,176 |
|
All |
$61,774 |
$64,200 |
$72,744 |
$73,472 |
$83,347 |
$86,436 |
3.7% |
$108,880 |
$111,500 |
$143,403 |
$144,837 |
Note, as SES employees are a smaller group, percentage changes for SES classifications can be more volatile than those for most non-SES classifications. It is therefore important to consider the differences in population size when comparing changes between SES and non-SES classifications. Similarly, the Graduate, APS 1 and APS 2 classifications can also be subject to more volatile percentage changes due to lower numbers of employees at these classifications.
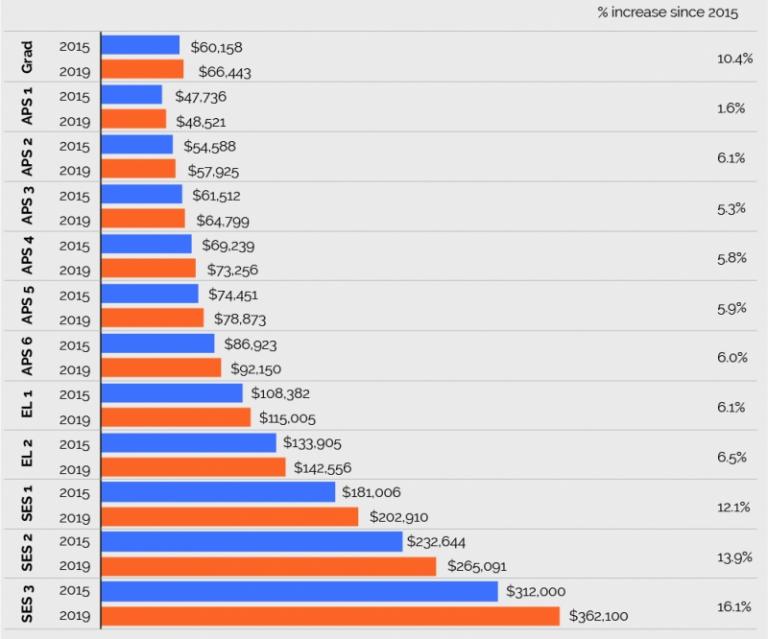
Figure 3.1 presents a comparison of median Base Salary by classification in 2015 and 2019. These are nominal figures, not adjusted for inflation. While all classification levels have seen increases over the period, the pace of change has varied. The greatest percentage increase in median Base Salary was 16.1% at the SES 3 classification. The smallest percentage increase in median Base Salary was 1.6% at the APS 1 classification.
Figure 3.1 Median Base Salary by classification, 2015 and 2019

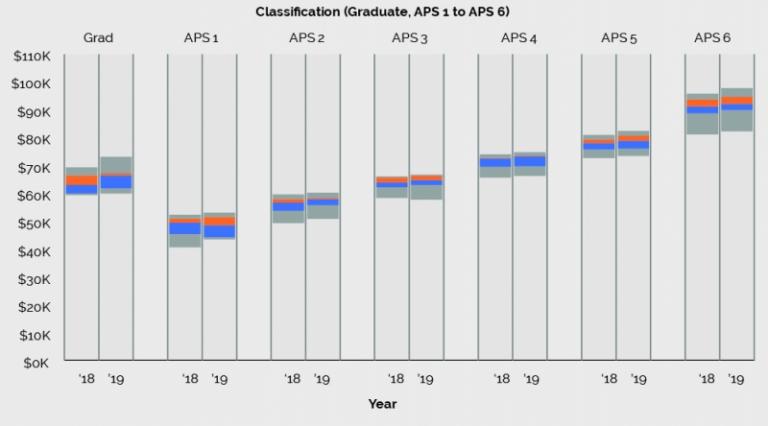
Figure 3.2 shows the changes in Base Salary ranges across classifications. The greatest widening of the salary range occurred at the Graduate and SES 3 classifications while the most obvious narrowing occurred at the APS 1 and APS 2 classifications.
With the exception of APS 3 and SES 3, all classifications increased at the 5th percentile. The decrease in the APS 3 5th percentile is likely to be a reflection of recruitment action at the base pay point for this classification.
Non-SES
As mentioned above, changes in median Base Salaries for non-SES classifications were heavily influenced by continuing enterprise agreements providing wage increases of 1% in 2019. Exceptions to this include the Graduate, APS 1 and APS 2 classifications.
From 2018 to 2019 the range of Graduate Base Salaries increased at the higher end which increased the median by 5.4%. A number of factors can produce significant variation in Graduate salaries from year to year. These include variation in the size of the Graduate cohort, differing internal reporting by agencies, differing commencement levels between agencies and changing recruitment patterns. The 2019 increase is influenced by higher paying agencies employing a proportionally greater number of graduates than lower paying agencies.
From 2018 to 2019 the APS 1 median Base Salary decreased by 1.9% while the 5th percentile increased by 7%. This is likely due to a large proportion of employees at the higher end of the pay range moving out of the classification, without new recruitment to the base of the pay range. As a very small cohort of under 500 employees, the APS 1 classification is susceptible to greater impacts by these type of influences.
Likewise, the 2.2% increase in the APS 2 median Base Salary from 2018 to 2019 suggests movement of employees up a pay scale, with little recruitment. This is consistent with data from the previous year which suggested a number of new employees commenced at the bottom of the pay range in 2018. It is noted there was a 24% reduction to the APS 2 headcount from 2018 to 2019.
SES
All SES classifications increased across all percentiles with the exception of the 5th percentile of the SES 3 (which decreased slightly by 0.5%). While increases at the median were relatively uniform (3.2% to 3.5%) changes at other percentiles were more variable. The largest increase at the 5th percentile was for the SES 2 which increased by 4.2%. The largest increase at the 95th percentile was for the SES 3 which increased by 4%. Movement in the SES 1 classification has been influenced by higher levels of recruitment within agencies paying salaries above the APS median.
Figure 3.2 Base Salary range by classification, 2018 and 2019


