Chapter 5: Total Reward
Total Reward (TR) represents the full remuneration amount for each employee.
TR is the sum of the Total Remuneration Package (TRP) plus bonuses. Bonuses include:
- individual performance bonuses
- sign-on bonuses
- productivity bonuses
- retention bonuses
- whole-of-agency or group performance bonuses.
The weighted [1] median TR movement from 2019 to 2020 was 0.3% for the whole of the APS, reflecting a weighted increase of 0.3% for non-SES employees and a decrease of 0.1% for SES (refer Appendix: Table 1b).
Total Reward by classification
Table 5.1 shows percentage changes in median TR by classification from 2019 to 2020.
As with Base Salary and TRP, the largest median movements occurred at the APS 1 and APS 2 classifications. The APS 1 classification increased by 4.0% and the APS 2 classification decreased by 2.8%.
The second highest median increase was 1.2% at the SES 3 classification.
Median TR for the Graduate, SES 1 and SES 2 classifications decreased by 0.5%, 0.1% and 0.5% respectively. There was nil movement at the APS 3 and APS 4 classifications.
TR values are close to those for TRP showing the small proportion that bonuses contribute to overall remuneration.
Table 5.1 Total Reward by classification, 2019 and 2020

Total Reward trends
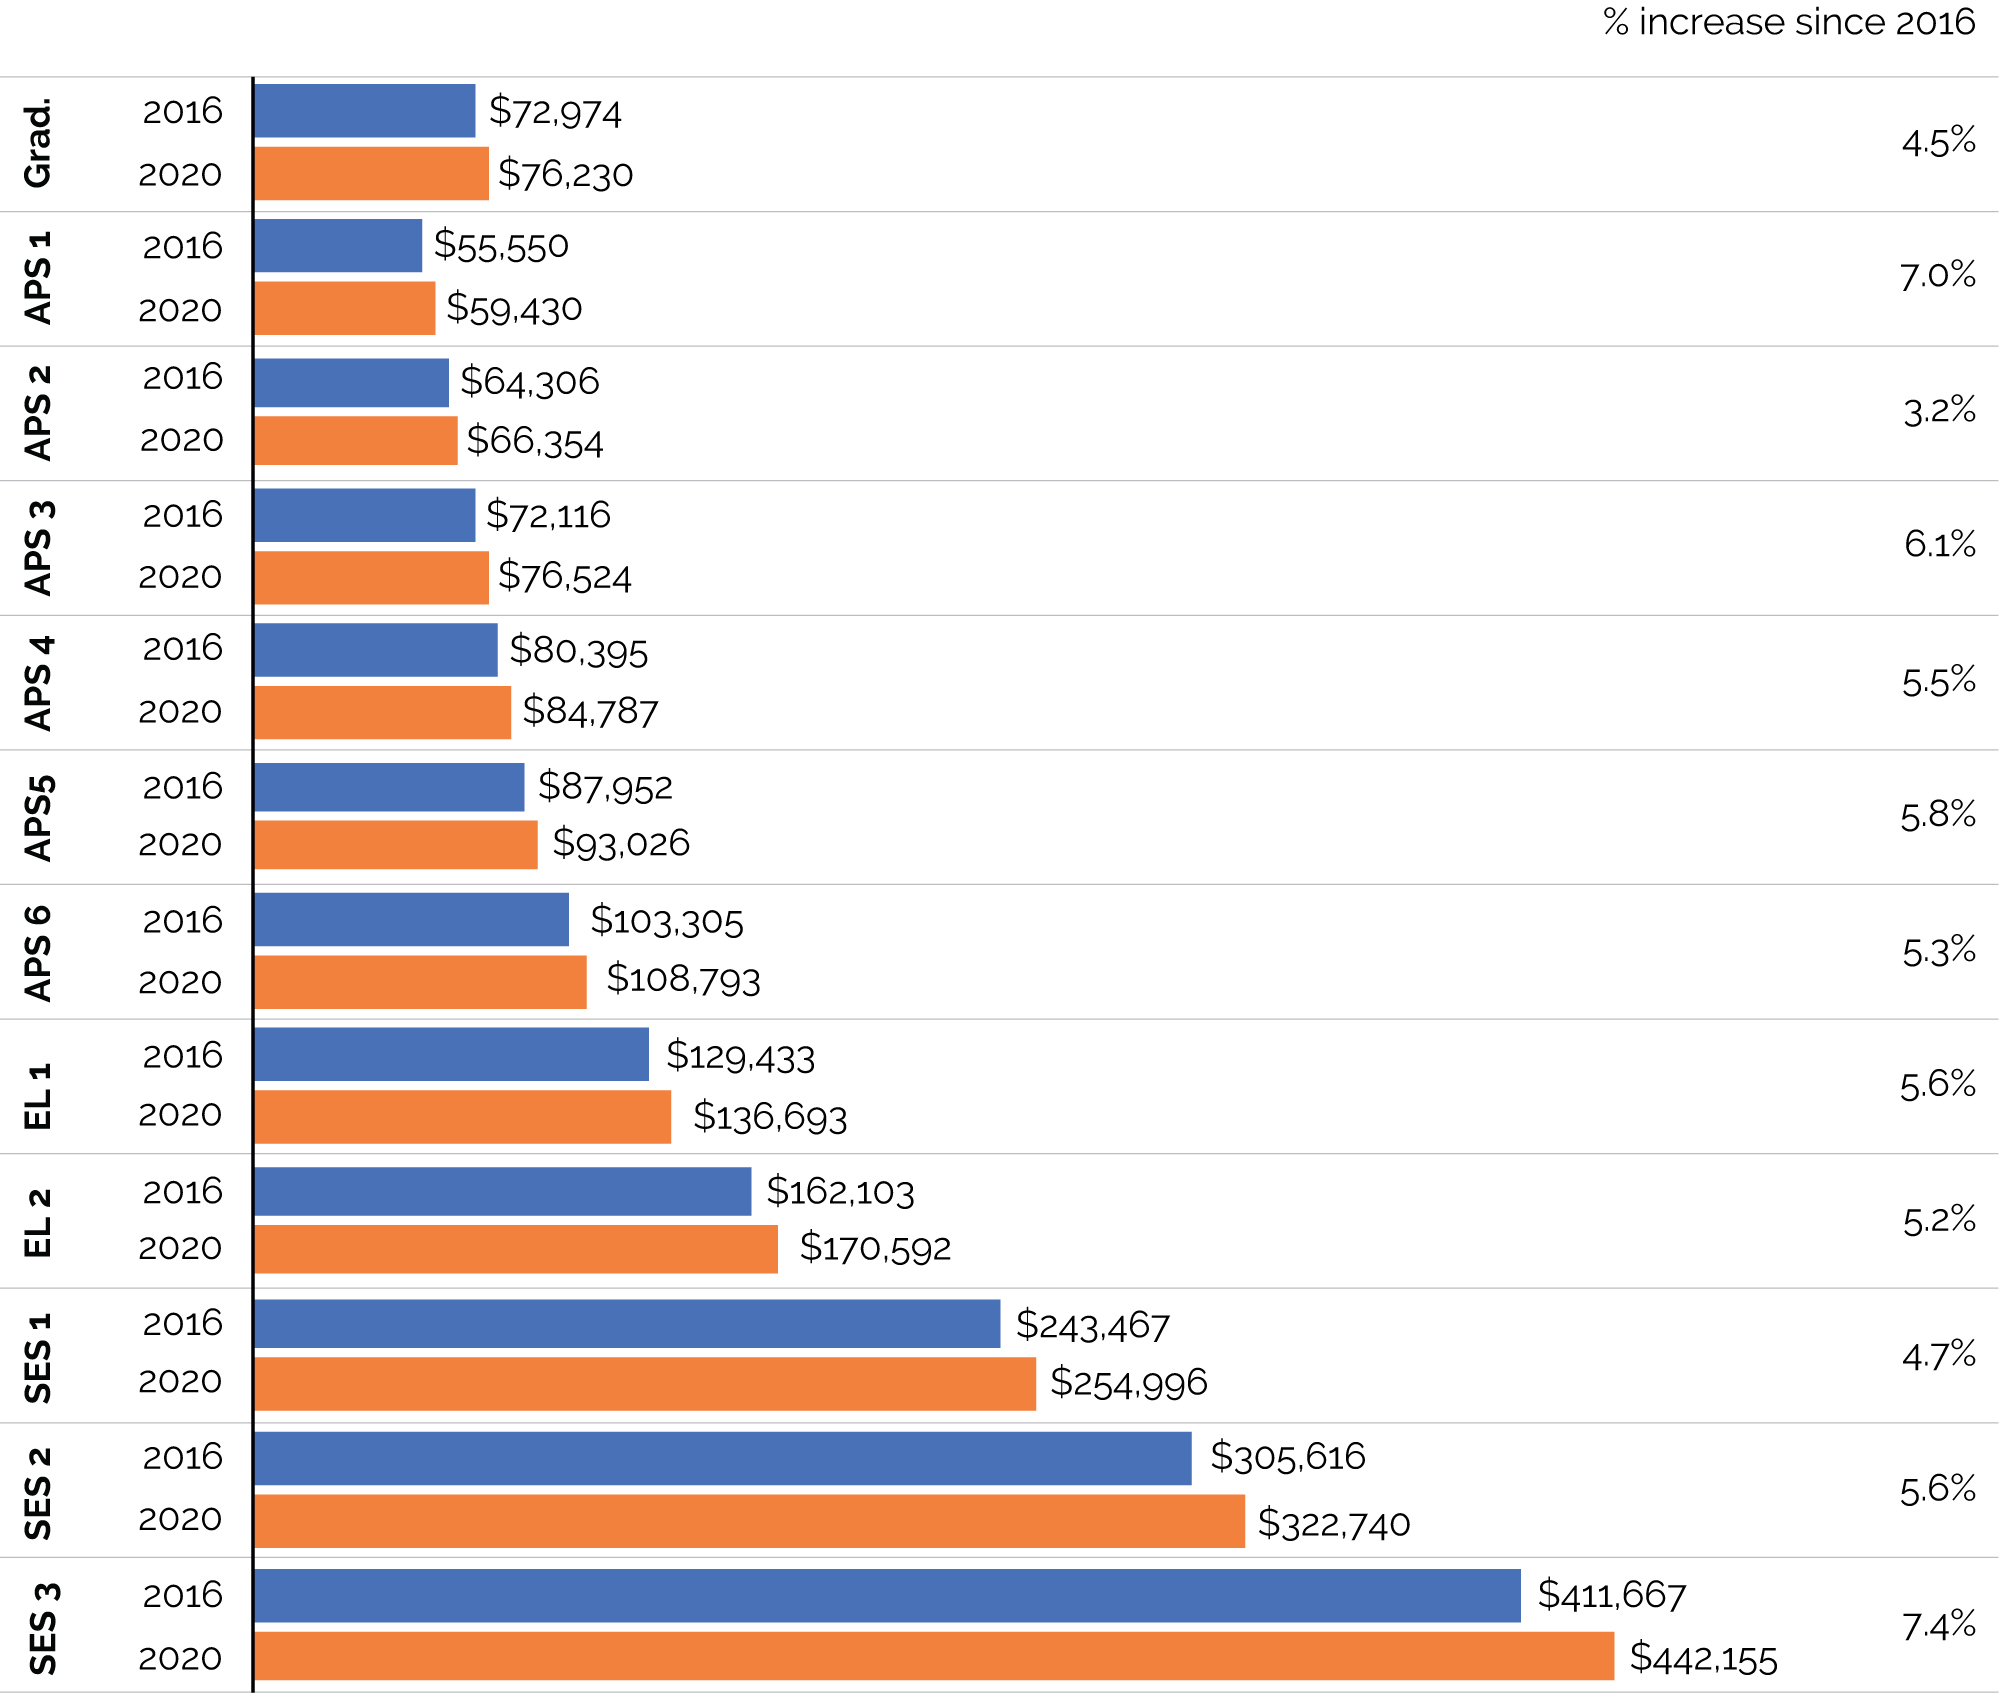
Figure 5.1 presents a comparison of median TR by classification in 2016 and 2020. Increases in TR are similar to those for TRP. The increases over the period range from 3.2% at the APS 2 classification to 7.4% at the SES 3 classification. As with TRP, increases in TR for SES levels were lower than those for Base Salary, reflecting some repackaging of remuneration components in previous years.
Figure 5.1 Median Total Reward by classification, 2016 and 2020

Figure 5.2 shows changes in TR ranges by classification. Movement in percentiles builds on changes to Base Salary and TRP.
Figure 5.2 Total Reward range by classification, 2019 and 2020

Performance bonuses
Figure 5.3 shows that the number of employees who received a performance bonus decreased from 19,282 in 2016 to 12,852 in 2020, which represents a 33% decrease.
From 2019 to 2020 the total number of employees who received a performance bonus decreased from 13,205 (or by 2.7%). When changes to population are factored in, the overall proportion of employees who received a performance bonus fell slightly from 9.9% in 2019 to 9.4% in 2020.
The majority of non-SES bonuses are payments made in lieu of increment progression provided under an enterprise agreement.
Just over 90% of performance bonuses paid to employees in 2020 were under $2,500. The median value of performance bonuses paid in 2020 remained unchanged from 2019 at $922.
Figure 5.3 Employees in receipt of performance bonus payments, 2016-2020

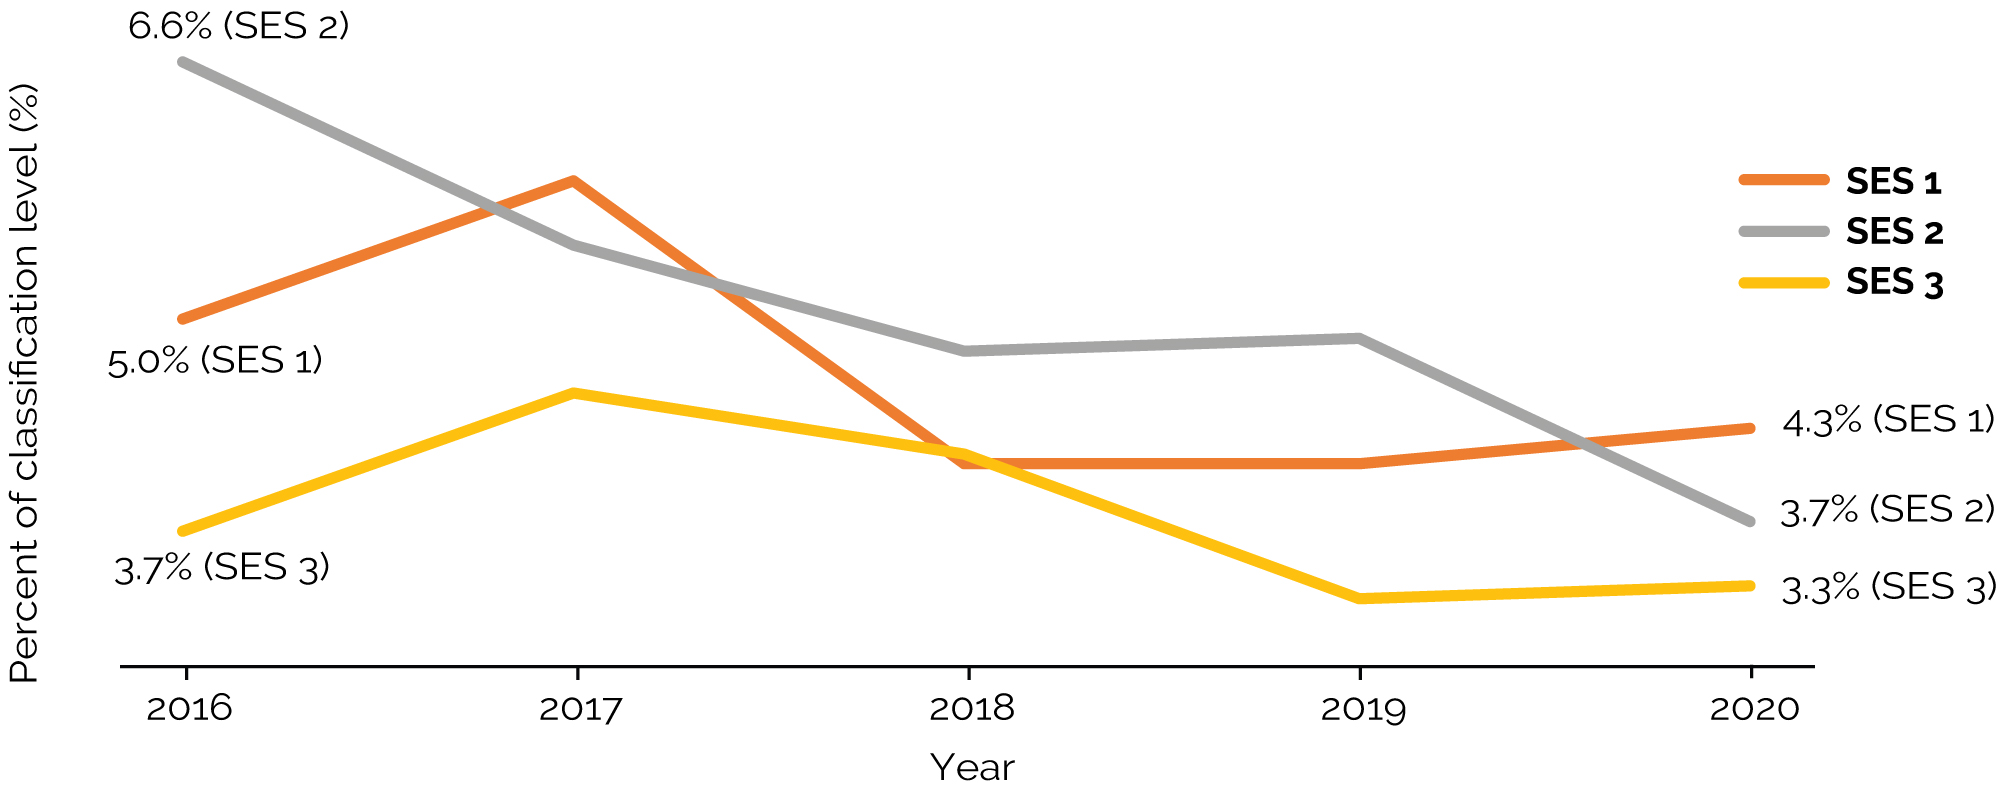
Performance and other bonus types have historically been a common feature for SES classifications. Figure 5.4 shows that the proportion of SES employees that received a performance bonus decreased from 2016 to 2020.
From 2019 to 2020, the overall proportion of SES employees that received a performance bonus remained unchanged at 4.2%. While the median bonus value for SES 2 employees increased by 5.3%, it decreased for SES 1 and SES 3 employees by 16.6% and 16.2% respectively.
Figure 5.4 Proportions of SES employees who received a performance bonus, 2016-2020

[1] For the purposes of comparisons between non-SES and SES employees, medians are adjusted to account for the number of employees at each level. These are referred to as ‘weighted’ medians. For further explanation refer to Appendix A.1.


