


Australian Public Service Remuneration report 2020
Foreword
The Australian Public Service (APS) Remuneration Report 2020 presents a summary of remuneration paid to APS employees under the Public Service Act 1999 as at 31 December 2020. The report provides APS agencies with data that informs their remuneration practices.
This annual report builds on several years of trend information and serves as an important public record for the APS.

Peter Woolcott AO
Australian Public Service Commissioner
July 2021
APS remuneration at a glance 2020
Executive Summary
Key findings for 2020
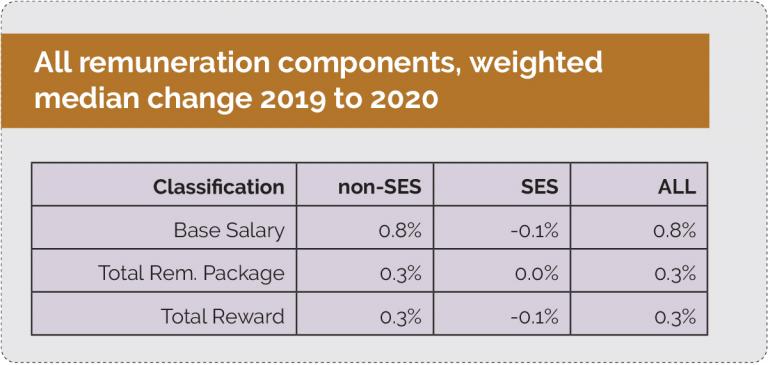
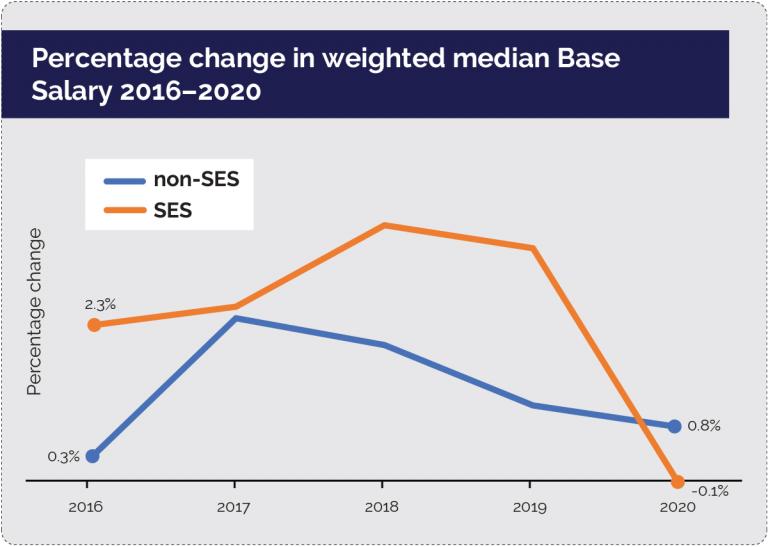
- The weighted [1] median Base Salary across all classifications increased by 0.8%. This reflects a weighted median increase of 0.8% for non-Senior Executive Service (SES) employees and decrease of 0.1% for SES employees.
- Weighted median Total Reward increased by 0.3% for non-SES employees and decreased by 0.1% for SES employees.
- The low percentage movements reflect the Australian Government’s decision to suspend or defer remuneration increases for Commonwealth public sector employees in response to the COVID-19 pandemic.
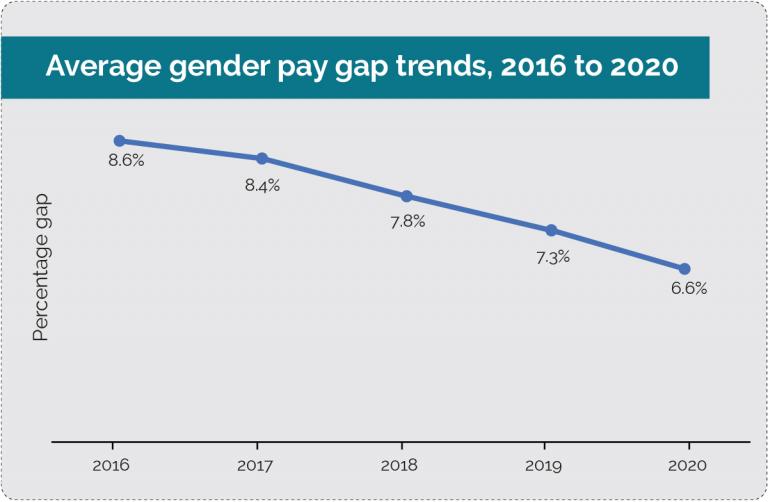
- The difference in overall average remuneration between genders has decreased from 7.3% in 2019 to 6.6% in 2020. Continuing increased female representation at senior classifications has influenced this change.
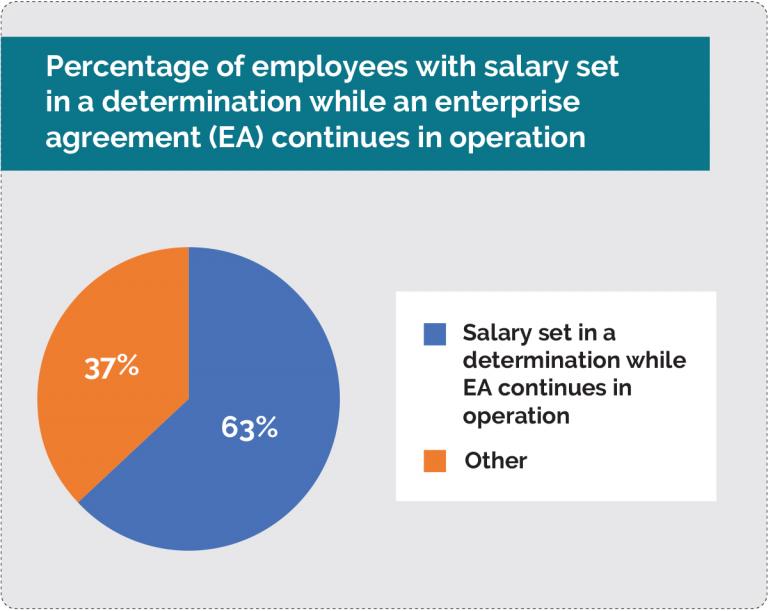
- Around 85,500 employees (or 63% of employees) had their salary set in a determination made under the Public Service Act 1999 while continuing to receive other terms and conditions through an enterprise agreement (or other primary employment instrument) that had passed its nominal expiry date. As at 31 December 2020, 57 agencies had used determinations to provide wage increases rather than bargaining new enterprise agreements.
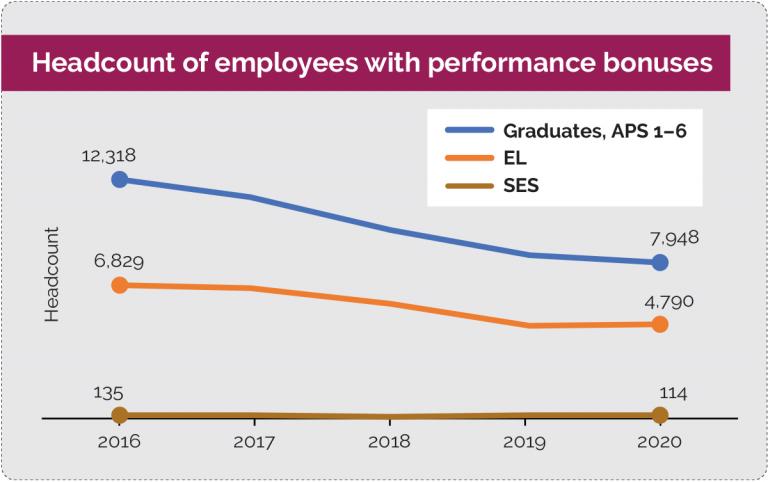
- 12,852 employees (9.4% of employees) received performance bonuses. This is a slight decrease from 13,205 employees (9.9% of employees) in 2019. The number of SES employees paid performance bonuses remained steady at 114 (or 4.2% of SES employees) between 2019 and 2020, but has declined overall since 2016. Most non-SES bonuses are payments made in lieu of increment progression.
Influences on the 2020 results
- In response to the COVID-19 pandemic, the Government deferred non-SES general wage increases by six months and requested that agency heads suspend all SES remuneration increases until further notice[2]. As a consequence over 60% of APS employees did not receive a general wage increase during 2020.
- The request to suspend SES remuneration increases extended to performance based salary advancement (where this was available) in addition to general wage increases and increases to allowances and entitlements. This was influential in the lower remuneration movements for SES, when compared with non‑SES employees. Non-SES employees that had not reached the top salary increment for their classification continued to receive performance advancement through salary scales.
- There was an overall increase in employee headcount for the Remuneration Survey from 133,356 in 2019 to 136,728 in 2020 with increased employee numbers in most classifications. The number of non-ongoing employees increased at a higher rate to ongoing employees, primarily at the APS 2 and APS 3 classifications.
- Remuneration movements in smaller classifications, in particular the APS 1 and APS 2, were greater due to the impact of population changes in these classifications. Median values for these classifications are more sensitive to changes in population due to the low number of employees.
- Machinery of Government Changes that took effect on 1 February 2020 reduced the number of government departments from 18 to 14. There were some significant movements of employees as a result of these changes. This may have had some impact on the data in this report depending on the differences in the gaining and losing agencies’ remuneration arrangements.
[1] For the purposes of comparisons between non-SES and SES employees, medians are adjusted to account for the number of employees at each level. These are referred to throughout the report as ‘weighted’ medians. For further explanation refer to Appendix A.1.
[2] The suspension of SES remuneration increases was lifted on 25 June 2021.