Data metrics
Previous data metrics
In the consultation paper, we recognised the multi-dimensional nature of the APS CALD workforce. A broad range of CALD related data is captured through APS agencies’ human resources information systems and made available centrally with the APS Employment Database (APSED).
Within the APS, CALD status has traditionally been measured using a derived variable known as Non-English Speaking Background (NESB). NESB is calculated based on an employee’s first language spoken, country of birth, year of arrival in Australia for those born overseas, father’s first language spoken, and mother’s first language spoken.
The concept of NESB, however, is no longer considered by the Australian Bureau of Statistics (ABS) to be an appropriate measure of CALD as it is unable to separately identify the many different CALD groups in Australia, and has developed negative connotations over time. The ABS no longer produces estimates of NESB in the population. Consequently, the APSC has been developing a measure of CALD from within existing data holdings that allows for benchmarking to the wider Australian community, as captured by the ABS Census.
The consultation paper used 2 different dimensions to identify CALD employees in the APS:
- country of birth, with CALD employees being those born outside of Australia
- language spoken at home, with CALD employees being those who spoke a language other than English at home.
Using these measures, as at 30 June 2023, CALD representation in the APS was 24% based on country of birth, and 22% based on the language spoken at home.
Refined quantitative data approach
Since then, the APSC has sought to improve its identification of CALD employees, particularly for second generation migrants. Second generation migrants who were born in Australia, and speak English at home, may still identify as CALD, based on their family ancestry.
We recognise that cultural and linguistic diversity is not confined to language by any means, although an employee’s first language spoken:
- is generally well known to employees
- has been collected for many years in APSED and will therefore enable analysis of individual employees over time
- captures second generation migrants, on the basis that first language spoken (or mother tongue) is a good proxy for an employee’s ancestry
- is a stable measure, as an employee’s first language does not change over their lifetime.
The ABS Census reports on the language spoken at home by employed persons in Australia aged 15 to 64. We believe this to be an appropriate comparator group against which to benchmark the APS workforce, given the limitations that exist when measuring other relevant markers of CALD identity.
To allow for comparisons to the broader community, this Plan will use an APS employee’s first language spoken to compare to the ABS Census measure of language spoken at home.
To contribute to a broader understanding of cultural and linguistic diversity within the APS, employee perception data will supplement the data in the APSED. The APS Employee Census will include questions that provide employees with the opportunity to identify as CALD and to indicate their cultural background.
Drawing on HR data and employee perception data provides the best possible approach in using existing sources. We will monitor and review what data is collected and used in the context of supporting the Plan.
We will also continue to use other data metrics, where appropriate, to illustrate different dimensions of the CALD experience.
The table below shows the high-level comparison of APS CALD employee representation compared to that of the Australian population, using this approach.
Table 1. Comparison of APS CALD employee representation to the Australian population
|
APSED December 2023 |
ABS Census of Population and Housing 2021 |
|
|---|---|---|
| SES equivalent | 11% | 15% |
| Non-SES equivalent | 25% | 24% |
| Total | 25% | 24% |
Source: ABS Census of Population and Housing 2021 and APS Employment Database December 2023.
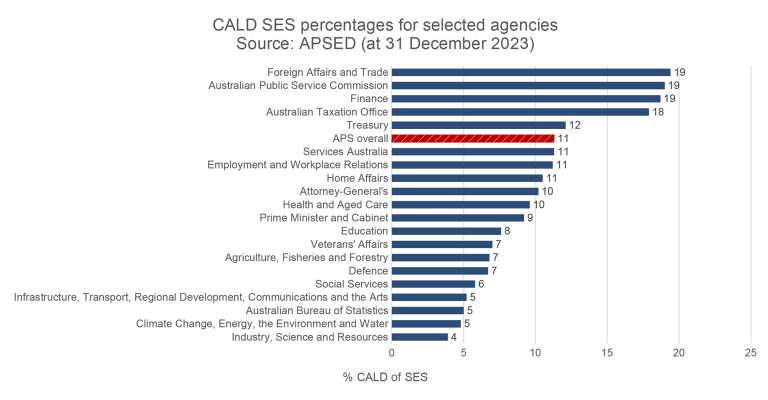
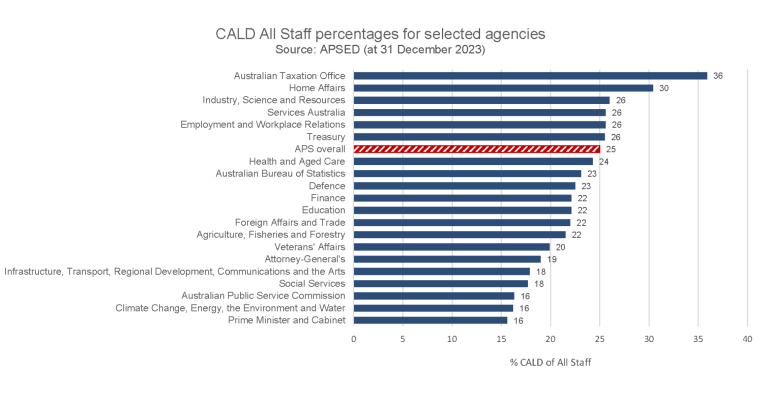
The employment data shows, in terms of the number of CALD employees across the APS as a whole, that we have representation similar to that in the broader Australian population. However, this representation drops sharply at the senior executive levels, which is reflected in the progression data.
This is consistent with research by Breunig, Hansell and Win from the ANU, who calculated the promotion odds of NESB and Asian-born employees. They noted that [6]:
For NESB, promotion prospects have stagnated or become worse over time. The promotion penalty for being in the NESB group, relative to non-NESB, grows at higher ranks of the public service. The penalty is present for Australian-born NESB and those who migrated to Australia at a very young age. This argues against an explanation driven entirely by language barriers or cultural assimilation. We also rule out an explanation for occupational segregation within the public service.
These findings highlight what many have told us:
- CALD people are not homogenous.
- How you are perceived and treated differs based on your individual characteristics and cultural heritage.
- How you are treated impacts on how you feel, that is on your lived experience.

Figure 1 - Senior Executive Service (SES) CALD representation as a proportion of SES in each agency 2023.[7]

Figure 2 - All Staff CALD representation as a proportion of all employees in each agency 2023. [8]
Footnotes
[5] The variable first language of employee was not exclusively English is not the same as the variable language spoken at home and has a different source, hence the proportions are slightly different between what was in the public consultation paper and what is in Table 1.
[6] R Breunig, D Hansell, and N N Win (October 2023), Modelling Australian Public Service Careers, Working paper complete_wp_breunig_hansell_win_oct_2023.pdf (anu.edu.au), p2.
[7] Source: APS Employment Database December 2023. Bars displayed in the bar chart represent unrounded percentages.
[8] APS Employment Database December 2023. Proportion of employees whose first language was not exclusively English. Missing data and ‘chose not to give this information’ responses excluded. Bars displayed in the bar chart represent unrounded percentages.


