Chapter 3: Base salary
Base Salary
Base Salary is an employee’s full-time equivalent annualised salary. It includes salary sacrifice amounts such as pre-tax employee superannuation contributions made via salary sacrifice arrangements. It excludes bonuses and other benefits.
The weighted median Base Salary increase from 2021 to 2022 was 1.8% for the whole of the APS. This reflects weighted median increases of 1.7% for non-SES employees and 4% for SES (see Appendix A.3: Table 1b).
Wages policies generally have a substantial influence on median remuneration movement. The majority of employees (65%) received general wage increases of 2% or 1.9% under former policy frameworks that continued during 2022.[4] A smaller proportion (35%) received a 3% increase under the Public Sector Interim Workplace Arrangements 2022 which applied to wage adjustments falling due from 1 September 2022.
From 2021 to 2022 the number of ongoing non-SES engagements and promotions increased by 27% and 13% respectively. Newly engaged and promoted employees made up 26.5% of ongoing non-SES employees in 2022, an increase from 23.5% in 2021.
Increased engagements and promotions can lower median values as newly engaged and promoted employees tend to commence on salaries at or near the bottom of their salary scale. This change to employee distribution across salary scales is a likely driver of the lower weighted median non-SES Base Salary increase, relative to wage increases.
The SES weighted median Base Salary increased by 4%. A number of factors contributed to the 2022 increase, including the following:
- The trend of repackaging motor vehicle related allowances into SES Base Salaries continued. The data suggests several agencies incorporated motor vehicle related allowances into Base Salaries for some or all of their SES employees, resulting in large Base Salary increases for this group. It is noted the proportion of SES employees paid a motor vehicle related allowance in 2022 was 27.1%, decreasing from 35.5% in 2021 and 60.3% in 2018.
- SES employees, like non-SES employees, were covered by wages policies that allowed for general wage increases of either 2%, 1.9% or 3%. SES employees are employed under individual arrangements negotiated directly with their agency and may be offered, or negotiate, higher levels of remuneration or a different remuneration package, for example to recognize a change in scope or responsibilities of a role.
- Transferring at level to another agency is associated with greater increases for SES employees due to a greater opportunity to negotiate a new remuneration package under individual arrangements. The number of SES employees transferring at level increased from 5.6% in 2021 to 7.9% in 2022 (excluding Machinery of Government transfers).
Base Salary movement by classification
Table 3.1 shows percentage changes in median Base Salary by classification from 2021 to 2022. The median Base Salary increased across all classifications, except the APS 2.
The highest median increase was 5% at the Graduate classification followed by 4.1% at the SES 1 classification.
The APS 2 median Base Salary decreased by 0.7%.
Table 3.1 Base Salary by classification, 2021 and 2022
| P5 | Q1 | Median | % change | Q3 | P95 | ||||||
|---|---|---|---|---|---|---|---|---|---|---|---|
| 2021 | 2022 | 2021 | 2022 | 2021 | 2022 | 2021 | 2022 | 2021 | 2022 | ||
| Grad. | $62,394 | $63,760 | $64,323 | $65,609 | $67,661 | $71,063 | 5.0% | $69,836 | $72,002 | $73,575 | $75,964 |
| APS 1 | $47,526 | $48,718 | $49,977 | $50,977 | $52,792 | $53,565 | 1.5% | $53,580 | $55,188 | $55,195 | $56,299 |
| APS 2 | $50,975 | $52,853 | $54,284 | $54,439 | $58,059 | $57,645 | -0.7% | $60,825 | $62,042 | $62,634 | $63,887 |
| APS 3 | $59,934 | $61,102 | $61,902 | $63,760 | $66,563 | $67,368 | 1.2% | $68,992 | $70,489 | $69,396 | $71,062 |
| APS 4 | $68,915 | $69,127 | $72,407 | $73,086 | $76,103 | $77,091 | 1.3% | $76,441 | $78,735 | $77,768 | $79,323 |
| APS 5 | $76,260 | $77,642 | $79,604 | $81,150 | $82,059 | $83,700 | 2.0% | $83,658 | $85,523 | $85,469 | $87,093 |
| APS 6 | $85,179 | $86,977 | $91,000 | $92,612 | $95,873 | $97,588 | 1.8% | $98,496 | $100,481 | $100,792 | $103,455 |
| EL 1 | $107,571 | $109,723 | $115,550 | $117,765 | $119,651 | $122,044 | 2.0% | $121,592 | $123,951 | $128,791 | $132,378 |
| EL 2 | $129,699 | $132,691 | $141,820 | $144,656 | $148,315 | $151,133 | 1.9% | $153,543 | $157,402 | $167,324 | $172,429 |
| SES 1 | $179,249 | $186,314 | $199,258 | $205,411 | $211,395 | $220,052 | 4.1% | $227,039 | $234,577 | $246,012 | $253,100 |
| SES 2 | $232,539 | $253,508 | $255,055 | $268,677 | $275,000 | $285,600 | 3.9% | $290,180 | $298,540 | $319,216 | $327,688 |
| SES 3 | $325,999 | $338,847 | $353,513 | $368,764 | $376,578 | $389,500 | 3.4% | $396,122 | $405,305 | $444,581 | $484,756 |
The 0.7% decrease at the APS 2 median was primarily due to a large intake of new employees in one agency which lowered the median Base Salary.
The Graduate median increased by 5%. A number of factors can produce wide variations in the Graduate median Base Salary from year to year. These include variation in the size of the Graduate cohort, differing internal reporting by agencies and differing commencement salaries between agencies. It is noted that in 2022 agencies with a proportionally higher number of graduates also had higher Graduate salary scales.
Given the small size of the population, median values for the APS 2 and Graduate classifications can be more volatile than for classifications with larger populations.
There were higher median increases across SES classifications compared to non-SES. These median movements were influenced by the factors outlined previously on this page.
Base Salary trends
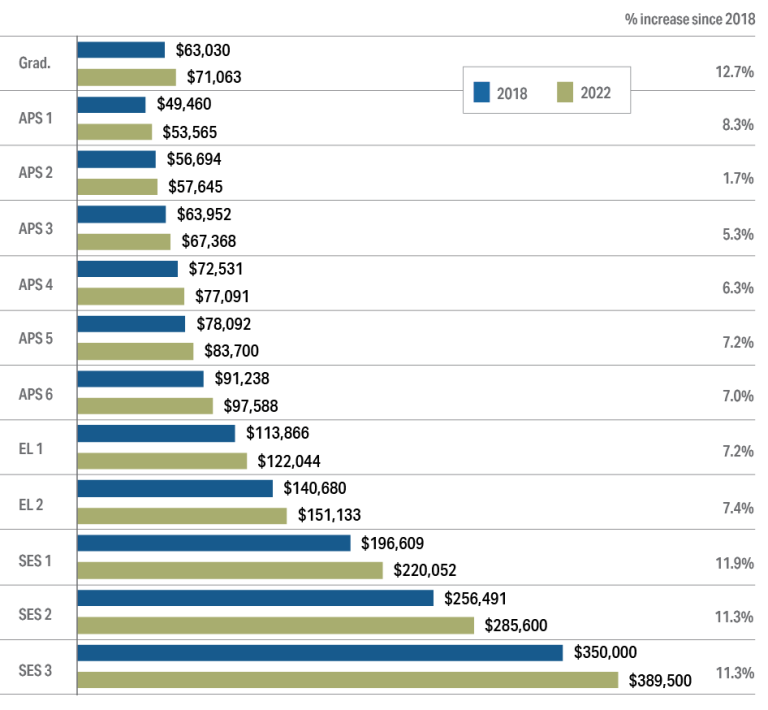
Figure 3.1 presents a comparison of median Base Salary by classification in 2018 and 2022. These are nominal figures, not adjusted for inflation. While all classification levels had Base Salary increases over the period, the pace of change continued to vary. Increases ranged from 1.7% at the APS 2 classification to 12.7% at the Graduate classification.
Over the period, movement in Base Salary for SES classifications has generally remained higher than for non-SES. This likely reflects repackaging of allowances into SES Base Salaries over time. As such, Total Remuneration Package and Total Reward are considered more reliable long-term comparisons.
Figure 3.1 Median Base Salary by classification, 2018 and 2022

Base Salary range
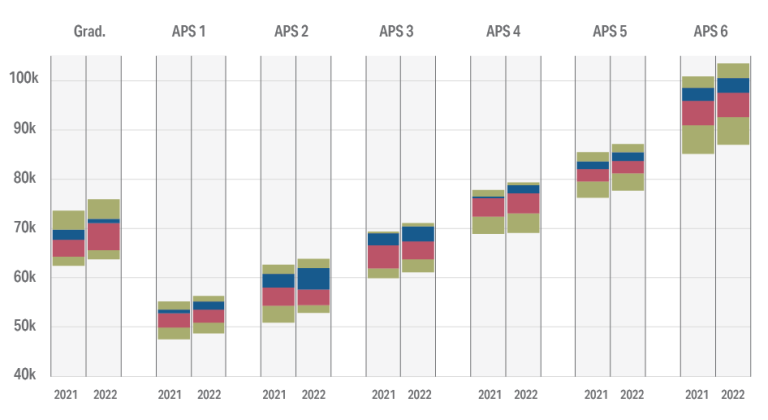
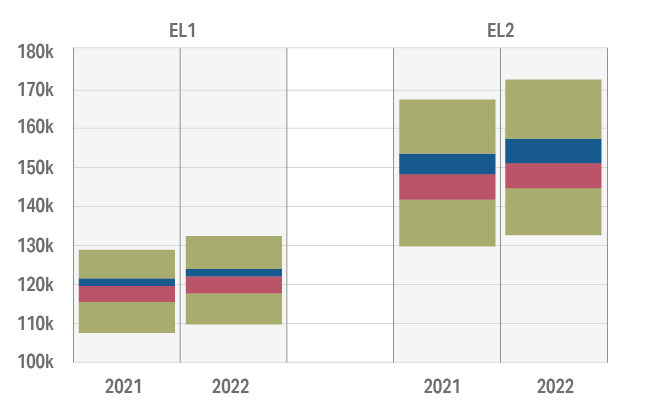
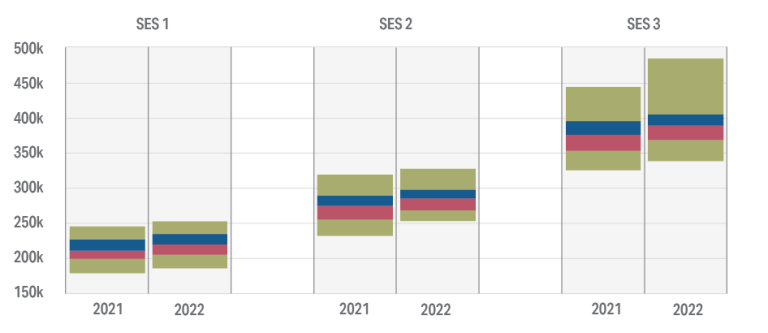
Figures 3.2a to 3.2c show changes in Base Salary ranges by classification from 2021 to 2022.
From bottom to top, each set of four boxes show the range of Base Salary values between the 5th and 95th percentiles in 2021 and 2022. The points where the boxes meet show the position, from the bottom of the plot to the top, of the 25th percentile (Q1), median and 75th percentile (Q3). See Appendix A.1 for further notes on interpreting these figures.
There were increases across most classifications and percentiles.
The range of values between the APS 2 median and 75th percentile widened, in part, because of a decrease to the median following a large intake of new employees in one agency, who commenced on salaries at the bottom of the pay scale.
The range of values between the Graduate median and 75th percentile narrowed indicating a greater concentration of employees on salaries just above the median.
Figure 3.2a Base Salary range by classification, 2021 and 2022 (Graduate, APS 1-6)

Movement across percentiles for EL 1 and EL 2 classifications was similar.
Figure 3.2b Base Salary range by classification, 2021 and 2022 (ELs)

There was similar movement at most percentiles across SES classifications. The 95th percentile for the SES 3 classification increased by 9%. As a classification with a very small population the spread of salaries across the SES 3 salary range is easily impacted by population changes.
Figure 3.2c Base Salary range by classification, 2021 and 2022 (SES)

Footnotes
[4] Wage adjustments scheduled before 1 September 2022 were covered under the Workplace Bargaining Policy 2018 or the Public Sector Workplace Relations Policy 2020.


