Chapter 4: Total remuneration package
Total Remuneration Package incorporates Base Salary plus benefits. It excludes bonuses which are included in Total Reward (see Chapter 5) and shift and overtime payments.
Benefits include:
- employer superannuation contribution
- motor vehicle cost/cash in lieu of motor vehicle
- motor vehicle parking
- any other benefits and supplementary payments.
Superannuation is the main component captured in Total Remuneration Package above Base Salary.
The weighted median Total Remuneration Package increase from 2021 to 2022 was 1.6% for the whole of the APS. This reflects weighted median increases of 1.6% for non-SES employees and 2.5% for SES (see Appendix A.3: Table 1b).
Total Remuneration Package movement by classification
Table 4.1 shows percentage changes in median Total Remuneration Package by classification from 2021 to 2022. There were increases across all classifications, except the APS 2.
The highest median increase was 5.8% at the Graduate classification followed by 3.3% for the SES 2.
The APS 2 median decreased by 0.5%, similar to Base Salary movement for this classification.
SES Total Remuneration Package increases were lower than SES Base Salary increases.
Table 4.1 Total Remuneration Package by classification, 2021 and 2022
| P5 | Q1 | Median | % change | Q3 | P95 | ||||||
|---|---|---|---|---|---|---|---|---|---|---|---|
| 2021 | 2022 | 2021 | 2022 | 2021 | 2022 | 2021 | 2022 | 2021 | 2022 | ||
| Grad. | $72,002 | $73,579 | $74,228 | $75,712 | $77,514 | $82,006 | 5.8% | $80,682 | $83,090 | $84,905 | $87,662 |
| APS 1 | $54,724 | $56,188 | $57,673 | $58,827 | $61,729 | $62,426 | 1.1% | $63,695 | $63,702 | $66,898 | $66,506 |
| APS 2 | $59,796 | $60,992 | $62,980 | $62,822 | $67,000 | $66,648 | -0.5% | $71,932 | $71,596 | $75,460 | $75,940 |
| APS 3 | $69,163 | $70,547 | $71,685 | $73,579 | $77,494 | $78,075 | 0.7% | $80,202 | $81,740 | $86,297 | $84,856 |
| APS 4 | $79,528 | $79,772 | $84,028 | $84,341 | $88,212 | $89,325 | 1.3% | $90,768 | $91,538 | $94,077 | $94,324 |
| APS 5 | $88,034 | $89,598 | $92,181 | $93,700 | $95,468 | $96,783 | 1.4% | $98,359 | $99,600 | $102,416 | $103,478 |
| APS 6 | $98,336 | $100,400 | $105,923 | $107,009 | $111,154 | $112,849 | 1.5% | $115,012 | $117,074 | $121,471 | $121,538 |
| EL 1 | $124,136 | $127,234 | $134,224 | $137,097 | $139,277 | $142,195 | 2.1% | $143,712 | $146,783 | $151,877 | $154,727 |
| EL 2 | $150,475 | $154,717 | $165,561 | $168,815 | $175,452 | $179,220 | 2.1% | $181,452 | $184,668 | $200,669 | $204,016 |
| SES 1 | $230,995 | $235,089 | $246,197 | $253,467 | $260,432 | $266,235 | 2.2% | $272,584 | $280,600 | $295,837 | $300,554 |
| SES 2 | $296,235 | $304,405 | $316,139 | $325,637 | $328,890 | $339,782 | 3.3% | $347,178 | $356,754 | $380,007 | $391,852 |
| SES 3 | $387,816 | $399,233 | $421,772 | $432,374 | $448,253 | $457,473 | 2.1% | $467,415 | $479,891 | $512,612 | $551,727 |
Total Remuneration Package trends
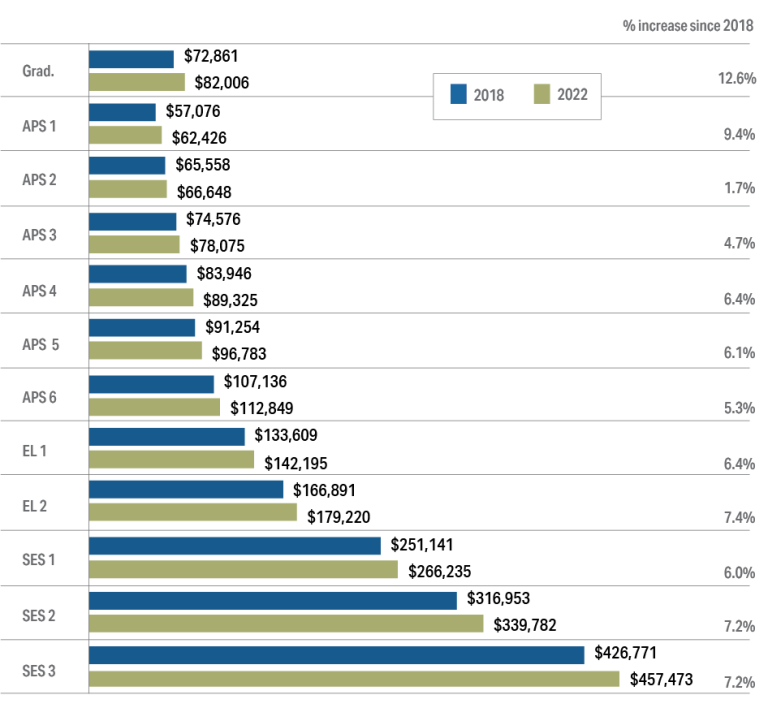
Figure 4.1 presents a comparison of median Total Remuneration Package by classification in 2018 and 2022. These are nominal figures, not adjusted for inflation. Increases ranged from 1.7% at the APS 2 classification to 12.6% at the Graduate classification. Movement in SES Total Remuneration Package was lower than movement in SES Base Salaries over the same period.
Figure 4.1 Median Total Remuneration Package by classification, 2018 and 2022
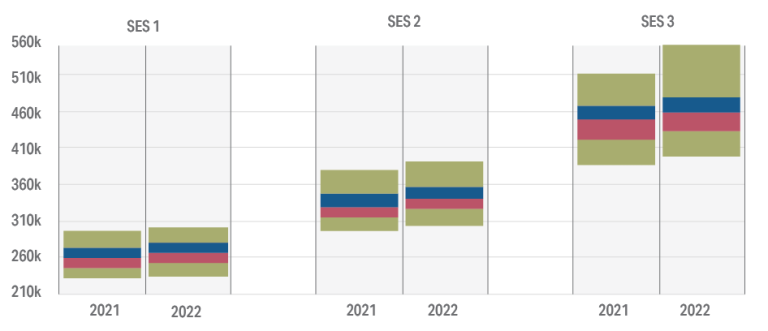
Total Remuneration Package range
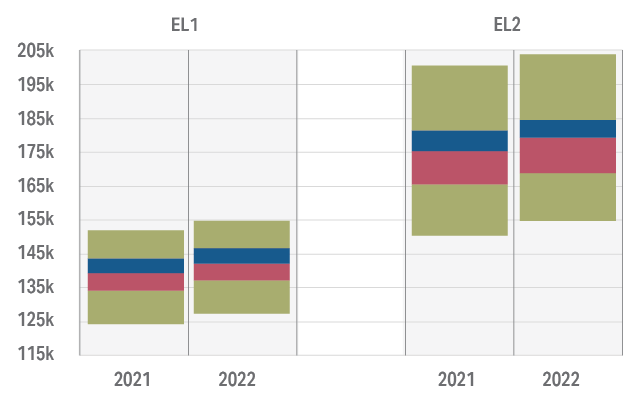
Figures 4.2a to 4.2c show changes in Total Remuneration Package ranges by classification from 2021 to 2022.
From bottom to top, each set of four boxes show the range of Total Remuneration Package values between the 5th and 95th percentiles in 2021 and 2022. The points where the boxes meet show the position, from the bottom of the plot to the top, of the 25th percentile (Q1), median and 75th percentile (Q3). See Appendix A.1 for further notes on interpreting these figures.
There were increases across most non-SES classifications and percentiles similar to Base Salary.
There was a decrease or very low movement at the 95th percentile for several non-SES classifications.
Figure 4.2a Total Remuneration Package range by classification, 2021 and 2022 (Graduate, APS 1-6)
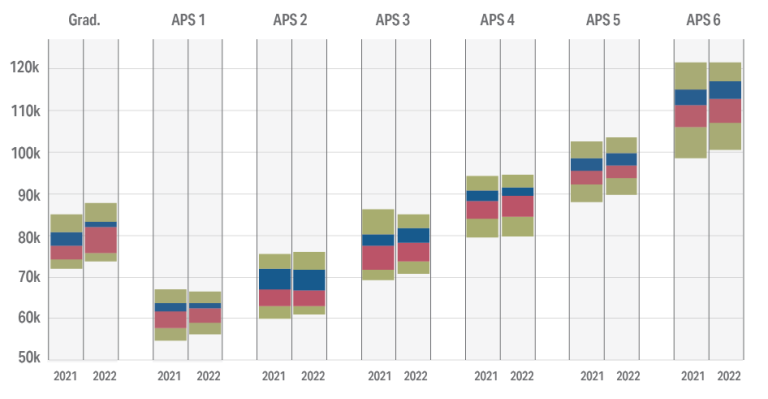
Figure 4.2b Total Remuneration Package range by classification, 2021 and 2022 (ELs)
SES classifications had lower increases across most percentiles compared to SES Base Salary movement. The SES 3 95th percentile increased by 7.6%, similar to Base Salary movement for this classification.
Figure 4.2c Total Remuneration Package range by classification, 2021 and 2022 (SES)
Superannuation
Employer superannuation contribution is the main component captured in Total Remuneration Package after Base Salary.
APS employee superannuation fund membership has been reported across four categories:
- Public Sector Superannuation Accumulation Plan
- Public Sector Superannuation Scheme
- Commonwealth Superannuation Scheme
- Other (non-Commonwealth funds).
Until November 2021, the Public Sector Superannuation Accumulation Plan was the default Commonwealth fund assigned to employees engaged under the Public Service Act 1999 who did not nominate an alternative complying superannuation fund. The employer contribution rate for the Public Sector Superannuation Accumulation Plan is 15.4% of superannuation salary.
Following introduction of the Your Future, Your Super reforms in November 2021, agencies have been required to make superannuation contributions to an employee’s pre-existing stapled fund (where one exists) rather than a default Commonwealth fund, unless the employee chooses otherwise.
The Public Sector Superannuation Scheme and Commonwealth Superannuation Scheme funds were closed to new entrants on 1 July 2005 and 1 July 1990 respectively.
Figure 4.3 shows that the Public Sector Superannuation Accumulation Plan had the highest membership up to the EL1 level (also see Appendix A.3: Table 9).
Public Sector Superannuation Scheme membership remains more common for employees at or above the EL 2 classification. This is consistent with the typical longer length of service for these individuals making them eligible for enrolment in this fund prior to its closure to new members in 2005.
Figure 4.3 Proportion of employees in superannuation fund by classification, 2022
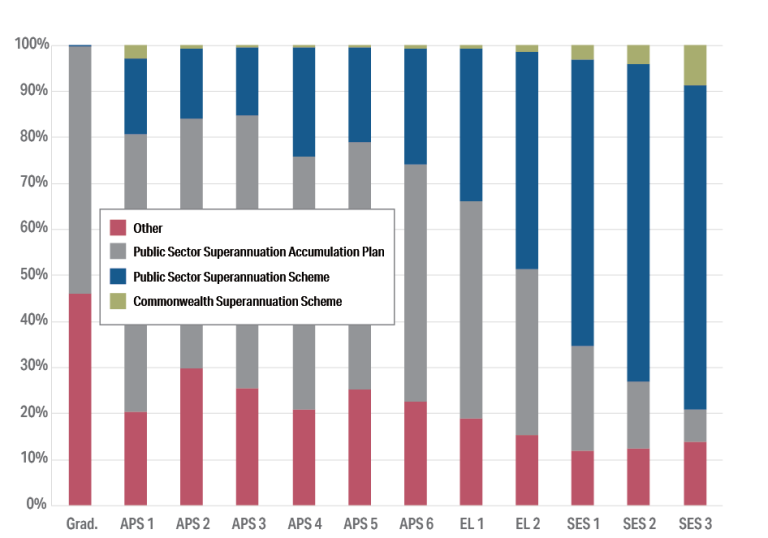
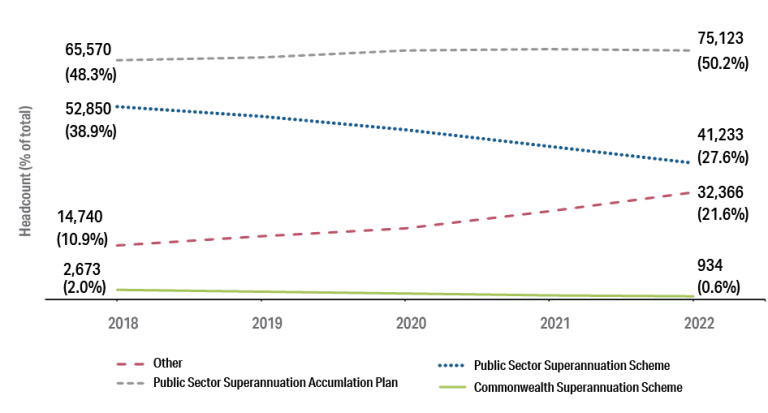
Figure 4.4 shows a continued decrease in Public Sector Superannuation Scheme and Commonwealth Superannuation Scheme membership over the last five years as members of these funds leave the APS. Over the same period Public Sector Superannuation Accumulation Plan membership increased slightly while the proportion of employees in Other superannuation funds doubled from 10.9% to 21.6%.
Non-Commonwealth superannuation fund membership is more common in lower classifications where employees are typically newer to the APS. Membership in Other funds was most evident at the Graduate classification where almost half (46.1%) of employees belonged to an Other fund (see Appendix A.3: Table 9).
Figure 4.4 Headcount of employees in superannuation fund (percentage of total)