


Chapter 8: Remuneration by gender
This chapter outlines key remuneration findings by gender [6]. It uses two measures to explore remuneration for female and male employees:
- The first uses average (mean) Base Salary to calculate the gender pay gap for the APS overall, allowing comparison to the National Gender Pay Gap.
- The second uses median Base Salary by gender within each classification level to assess differences in remuneration for comparable work value.
APS gender pay gap
The gender pay gap can be an indicator of how the contribution of each gender is valued in a workforce, and as such it is monitored at a national level, and across the APS. The gender pay gap is the difference between male and female employees’ earnings, expressed as a percentage of male earnings. While unequal pay is a potential influence, the gender pay gap is not a measure of the extent to which females and males are paid equally for the same work[7].
The APS gender pay gap calculation method uses average Base Salary of both full-time and part-time employees, with part-time salaries annualised to full-time equivalent earnings. Using Base Salary and an average (or mean) ensures that the APS gender pay gap is comparable to the National Gender Pay Gap. The National Gender Pay Gap uses data from the Australian Bureau of Statistics and is one of two gender pay gap methods applied by the Workplace Gender Equality Agency.[8]
In 2022, the average Base Salary for males in the APS was $104,668 while the average Base Salary for females was $99,200. This represents a 5.2% gender pay gap for the APS and continues the improvement shown since 2018 (Figure 8.1).
Figure 8.1 Average gender pay gap trends with data table, 2018 to 2022
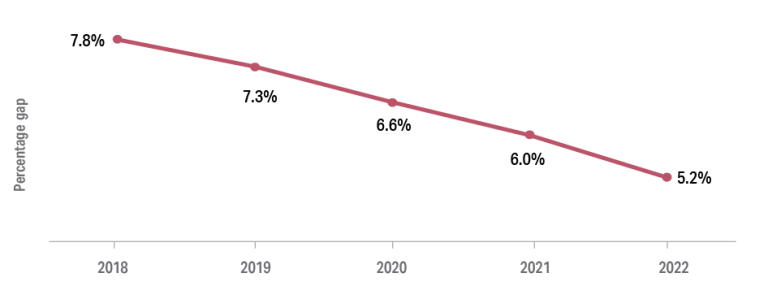
| Female | 2018 | 2019 | 2020 | 2021 | 2022 |
| Average Base Salary | $88,896 | $91,016 | $92,536 | $96,006 | $99,200 |
| Headcount | 79,860 | 78,789 | 81,049 | 85,446 | 89,544 |
| Male | 2018 | 2019 | 2020 | 2021 | 2022 |
| Average Base Salary | $96,391 | $98,149 | $99,082 | $102,112 | $104,668 |
| Headcount | 55,928 | 54,500 | 55,622 | 57,473 | 59,795 |
Note: As the data is annualised, the higher proportion of women working part-time hours is not directly reflected in the APS gender pay gap
Remuneration by gender and classification
The remuneration of males and females within each classification level is a measure which can be used to explore gender differences in remuneration for comparable work value based on the APS Classification Guide and Work Level Standards.
Figure 8.2 shows the differences between male and female median Base Salaries. The majority were within a range of +/-0.5%. A negative value indicates that females in this classification received a higher median Base Salary than males. From 2021 to 2022 the small gaps between female and male median Base Salaries at most senior classifications further decreased.
Figure 8.2 Median Base Salary by gender and classification, 2022
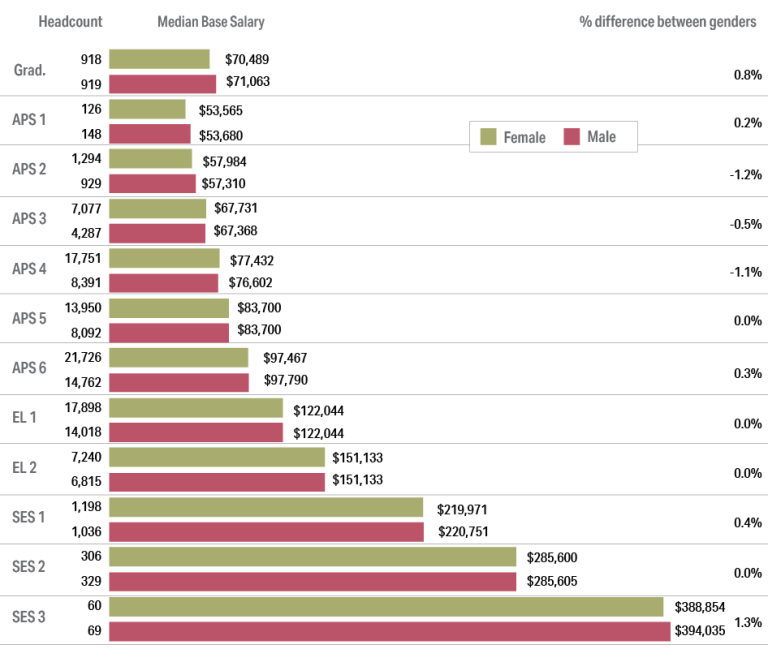
Note: The percentage difference between genders is the difference between male and female median Base Salaries expressed as a percentage of male earnings.
The small gender pay gaps at each level suggest that the overall APS gender pay gap is not due to unequal pay for comparable work, but rather the distribution of females and males across the classification structure.
Analysis conducted by the APSC[9] further supports this, finding that the gender pay gap is primarily driven by the different representation of males and females across classifications, particularly the higher number of females at the APS 3 to APS 5 levels. APSC analysis also suggests it is not a lack of promotions of females that is leading to their overrepresentation at these levels. Future APSC research will investigate other potential factors that may be associated with this pattern, such as the type of work being undertaken at those levels and the locations of those roles.
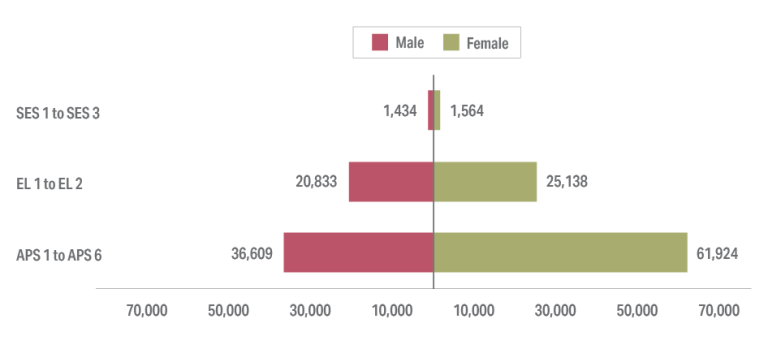
The graph below illustrates that while there is strong overall representation of females at the Executive and Senior Executive levels, there is a larger proportion of female employees at the more junior levels that results in a lower overall average female Base Salary. This suggests a gap will remain to some extent unless there is more gender balance at these lower classifications.
Figure 8.3 Number of males and females by classification group
Female representation in the APS
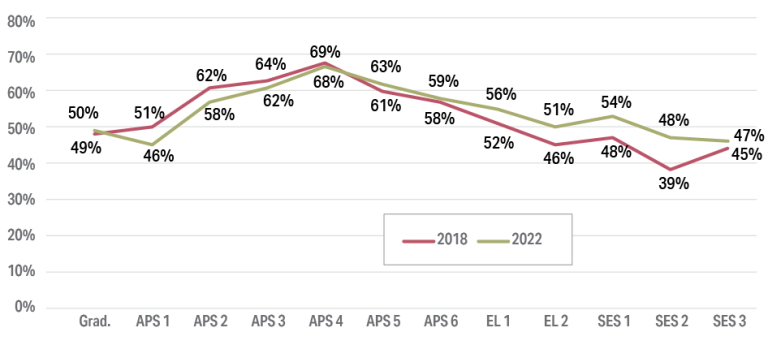
Overall females represent 60% of the APS workforce. Figure 8.3 shows how the proportion of females in each classification has changed over time. The data shows there has been a consistent increase in the proportion of females at higher classification levels (EL 1 and above) since 2018, along with a slight decrease in the proportion of females at lower classifications. This trend is consistent with the narrowing gender pay gap over this time.
Figure 8.4 Females as a percentage of APS population by classification, 2018 and 2022
Individual flexibility arrangements by gender
Table 8.1 shows the headcount and the proportion of employees with an individual flexibility arrangement for each APS classification, by gender. Individual flexibility arrangements are discussed further in Chapter 9.
Table 8.1 Number of employees with an individual flexibility arrangement by classification and gender
| Classification | Gender | Headcount | Individual flexibility arrangements | Percentage of gender with an individual flexibility arrangement |
|---|---|---|---|---|
| Graduate | Female | 918 | . | . |
| Male | 919 | 1 | 0.1% | |
| APS 1 | Female | 126 | . | . |
| Male | 148 | . | . | |
| APS 2 | Female | 1,294 | . | . |
| Male | 929 | 2 | 0.2% | |
| APS 3 | Female | 7,077 | 14 | 0.2% |
| Male | 4,287 | 26 | 0.6% | |
| APS 4 | Female | 17,751 | 65 | 0.4% |
| Male | 8,391 | 63 | 0.8% | |
| APS 5 | Female | 13,950 | 106 | 0.8% |
| Male | 8,092 | 91 | 1.1% | |
| APS 6 | Female | 21,726 | 344 | 1.6% |
| Male | 14,762 | 361 | 2.5% | |
| EL 1 | Female | 17,898 | 664 | 3.7% |
| Male | 14,018 | 713 | 5.1% | |
| EL2 | Female | 7,240 | 780 | 10.8% |
| Male | 6,815 | 839 | 12.3% |
Footnotes
[6] Note: APS Remuneration Survey data used within this chapter does not include employees who identify as indeterminate/intersex/unspecified due to these numbers being statistically small.
[7] https://www.abs.gov.au/statistics/understanding-statistics/guide-labour-statistics/gender-pay-gap-guide : "Measuring the gender pay gap".
[8] The two gender pay gap methods monitored by Workplace Gender Equality Agency are: • The National Gender Pay Gap, which uses Base Salary data from the Australian Bureau of Statistics survey of Average Weekly Earnings; and • The WGEA Annual Gender Pay Gap, which uses Total Remuneration data from the Workplace Gender Equality Agency’s annual employer census. Source: https://www.wgea.gov.au/pay-and-gender/how-to-calculate-gender-pay-gap - "How to calculate gender pay gap"
[9] See APSC Research Note 03-23 (available at www.apsc.gov.au )