Chapter 5: Total reward
Total Reward incorporates Total Remuneration Package plus bonuses. Bonuses include:
- performance bonuses
- sign-on bonuses
- productivity bonuses
- retention bonuses
- whole-of-agency or group performance bonuses
- fixed top-of-salary-range payments in lieu of increment progression.
The weighted median Total Reward increase from 2021 to 2022 was 1.7% for the whole of the APS. This reflects weighted increases of 1.7% for non-SES employees and 2.6% for SES (see Appendix A.3: Table 1b).
Total Reward movement by classification
Table 5.1 shows percentage changes in median Total Reward by classification from 2021 to 2022. There were increases across all classifications, except the APS 2.
The highest median increase was 5.8% at the Graduate classification followed by 3.3% for the SES 2 classification. The APS 2 median Total Reward decreased by 0.5%, similar to Base Salary and Total Remuneration Package movement for this classification.
Total Reward values are close to those for Total Remuneration Package showing the small proportion that bonuses contribute to overall remuneration.
Table 5.1 Total Reward by classification, 2021 and 2022
| P5 | Q1 | Median | % change | Q3 | P95 | ||||||
|---|---|---|---|---|---|---|---|---|---|---|---|
| 2021 | 2022 | 2021 | 2022 | 2021 | 2022 | 2021 | 2022 | 2021 | 2022 | ||
| Grad. | $72,003 | $73,579 | $74,229 | $75,713 | $77,515 | $82,007 | 5.8% | $80,682 | $83,090 | $84,906 | $87,662 |
| APS 1 | $54,724 | $56,189 | $57,673 | $58,827 | $61,831 | $63,232 | 2.3% | $63,695 | $64,030 | $67,281 | $66,708 |
| APS 2 | $59,797 | $60,992 | $62,990 | $62,823 | $67,000 | $66,648 | -0.5% | $72,018 | $72,321 | $75,841 | $76,288 |
| APS 3 | $69,164 | $70,547 | $71,686 | $73,579 | $77,496 | $78,075 | 0.7% | $80,232 | $81,947 | $86,330 | $84,948 |
| APS 4 | $79,528 | $79,773 | $84,028 | $84,341 | $88,213 | $89,325 | 1.3% | $90,768 | $91,539 | $94,135 | $94,325 |
| APS 5 | $88,042 | $89,599 | $92,182 | $93,700 | $95,733 | $96,956 | 1.3% | $98,624 | $99,678 | $102,741 | $103,478 |
| APS 6 | $98,368 | $100,400 | $105,930 | $107,009 | $111,596 | $113,828 | 2.0% | $115,502 | $117,074 | $121,563 | $121,538 |
| EL 1 | $124,150 | $127,234 | $134,230 | $137,098 | $139,382 | $142,340 | 2.1% | $144,113 | $146,783 | $152,137 | $155,118 |
| EL 2 | $150,554 | $154,720 | $165,636 | $169,083 | $175,706 | $179,388 | 2.1% | $181,846 | $184,669 | $202,500 | $204,846 |
| SES 1 | $231,387 | $236,388 | $246,801 | $253,621 | $260,601 | $266,842 | 2.4% | $273,250 | $281,382 | $297,553 | $301,867 |
| SES 2 | $296,235 | $304,405 | $316,807 | $325,637 | $329,099 | $339,840 | 3.3% | $347,620 | $357,125 | $383,199 | $391,947 |
| SES 3 | $389,653 | $399,233 | $421,772 | $432,374 | $449,310 | $460,077 | 2.4% | $467,871 | $480,403 | $512,612 | $551,727 |
Total Reward trends
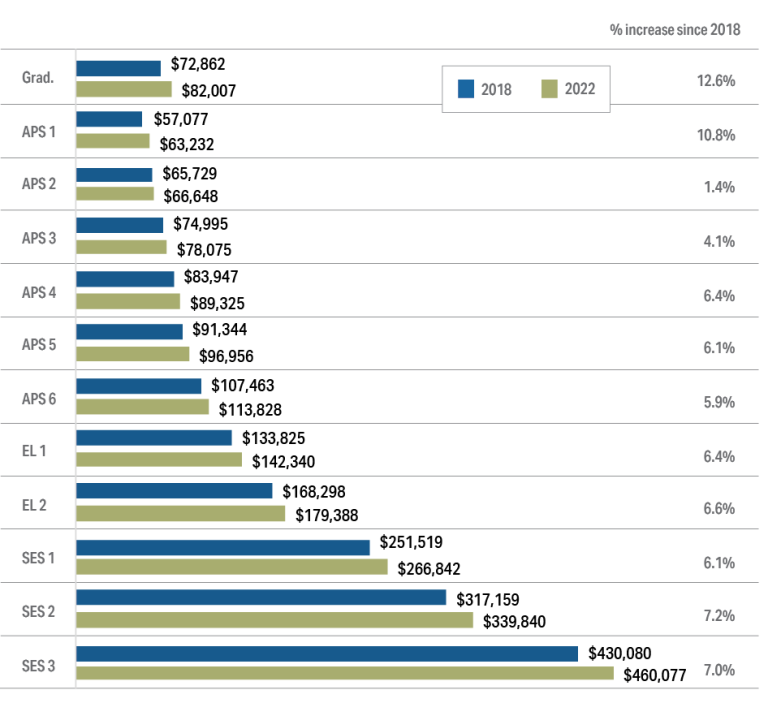
Figure 5.1 presents a comparison of median Total Reward by classification in 2018 and 2022. These are nominal figures, not adjusted for inflation. Increases in Total Reward are similar to those for Total Remuneration Package. Increases ranged from 1.4% at the APS 2 classification to 12.6% at the Graduate classification. As with Total Remuneration Package, movement in Total Reward for SES levels was lower than movement in SES Base Salaries.
Figure 5.1 Median Total Reward by classification, 2018 and 2022
Total Reward range
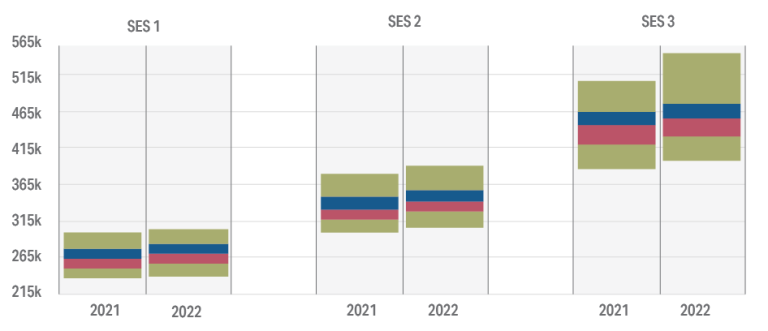
Figures 5.2a to 5.2c show changes in Total Reward ranges by classification. Movement across percentiles was consistent with Total Remuneration Package movement.
From bottom to top, each set of four boxes show the range of Total Reward values between the 5th and 95th percentiles in 2021 and 2022. The points where the boxes meet show the position, from the bottom of the plot to the top, of the 25th percentile (Q1), median and 75th percentile (Q3). See Appendix A.1 for further notes on interpreting these figures.
Figure 5.2a Total Reward range by classification, 2021 and 2022 (Graduate, APS 1-6)
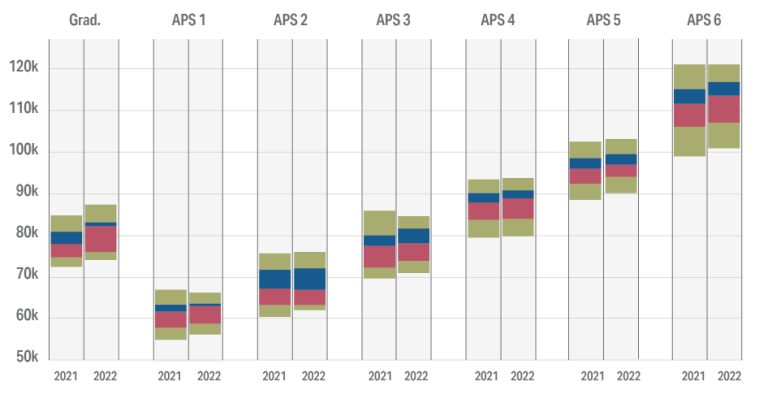
Figure 5.2b Total Reward range by classification, 2021 and 2022 (ELs)
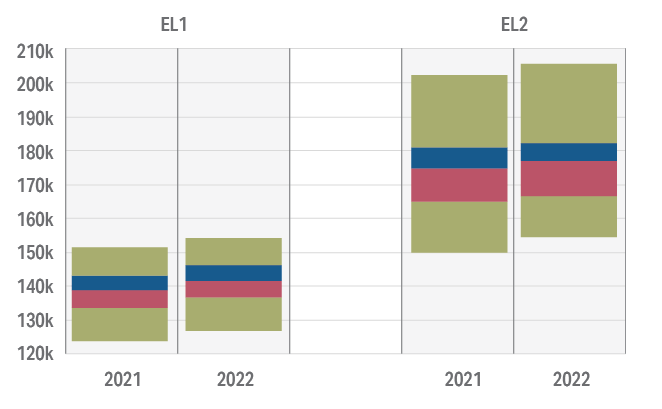
Figure 5.2c Total Reward range by classification, 2021 and 2022 (SES)
Performance bonuses
For the purposes of this report, performance bonuses are defined as payments that are at-risk and variable based on performance.
The number of employees paid a performance bonus decreased from 1,100 in 2021 to 765 employees in 2022 representing a 30% decrease.
The number of agencies that paying performance bonuses also decreased, from 19 in 2021 to 13 in 2022.
Figure 5.3 shows the number of employees paid a performance bonus broken down by classification group in 2021 and 2022. There was a decrease in bonuses paid across each classification group with the greatest decrease occurring at SES levels. The number of SES employees paid a performance bonus decreased from 115 in 2021 to 36 in 2022. This represents a 69% decrease.
The median performance bonus paid in 2022 was $1,286 decreasing from $1,674 in 2021. The decrease in the median reflects the large decrease in SES bonuses.
The reduced use of performance bonuses, particularly at SES levels, is consistent with Australian Government policy as outlined in the Performance Bonus Guidance – Principles governing performance bonus use in Commonwealth entities and companies published in August 2021. The guidance sets out the Government’s expectations that performance bonuses are used only in limited circumstances
Figure 5.3 Employees paid a performance bonus (percentage of total), 2021 and 2022[5]
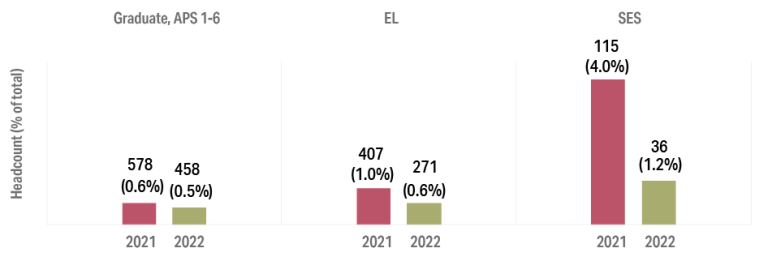
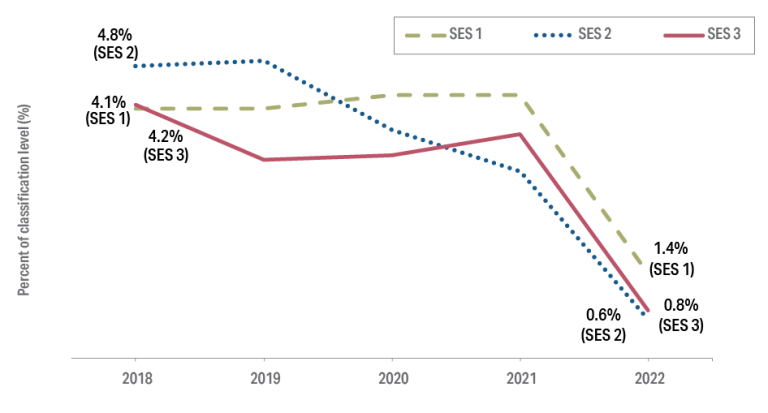
Figure 5.4 shows the proportion of SES employees paid a performance bonus over a five year period broken down by classification.
The median SES performance bonus paid in 2022 was $6,022 decreasing from $10,249 in 2021.
Figure 5.4 Proportions of SES employees paid a performance bonus, 2018 to 2022
Footnotes
[5]Fixed top-of-salary-range payments were excluded from performance bonus reporting in 2021. This reduced the number of non-SES performance bonuses reported by over 90% in 2021 but had no meaningful impact on reporting for SES performance bonuses.


