


Australian Public Service Remuneration Report 2022
Foreword
The Australian Public Service Remuneration Report 2022 presents a summary of remuneration paid to employees under the Public Service Act 1999 as at 31 December 2022. The report provides Public Service Act agencies with data that informs their remuneration practices.
This annual report builds on several years of trend information and serves as an important public record.
![]()
Dr Gordon de Brouwer PSM
Australian Public Service Commissioner
August 2023
APS remuneration at a glance 2022
Executive summary
Key findings for 2022
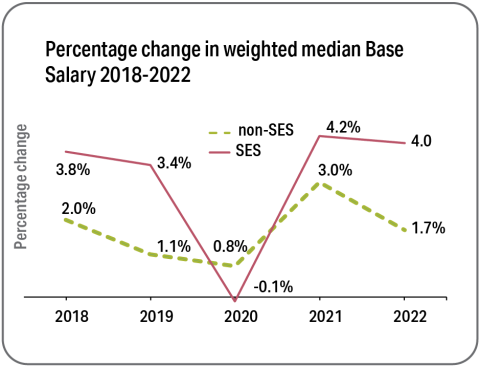
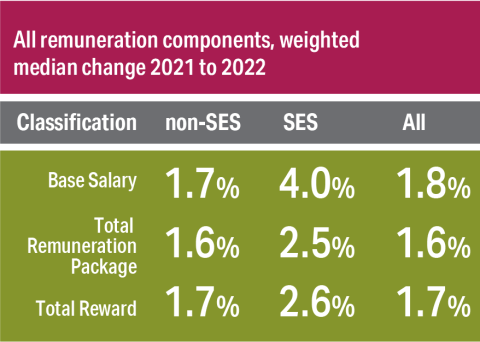
- The weighted[1] median Base Salary increase across the APS was 1.8%. This reflects a weighted median increase of 1.7% for non-Senior Executive Service (SES) employees and 4% for SES employees.
- The weighted median Total Reward increase was 1.7% for non-SES employees and 2.6% for SES employees.
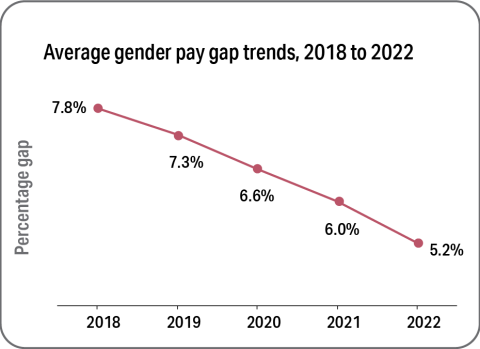
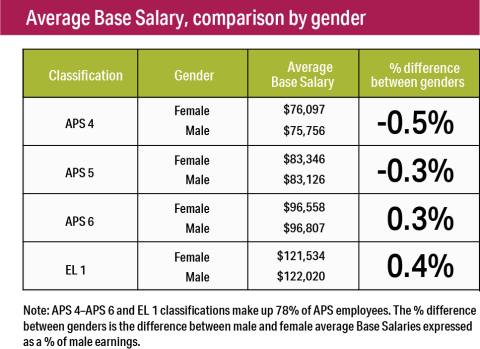
- The difference in overall average remuneration between genders was 5.2%, decreasing from 6% in 2021 and 7.8% in 2018. On a classification by classification basis there were only small differences between male and female average Base Salaries. Most differences were less than 1%.[2]
- The number of SES employees paid a performance bonus decreased from 115 in 2021 to 36 in 2022. This represents a 69% decrease.
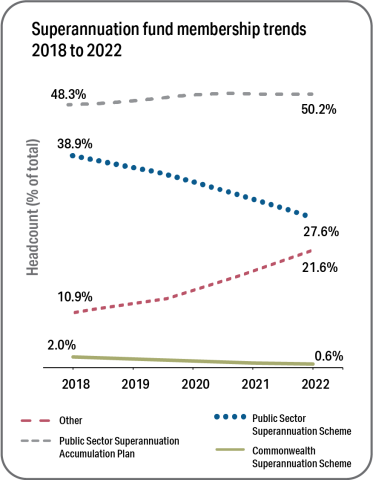
- One out of five employees belonged to a non-Commonwealth superannuation fund. Membership in non-Commonwealth funds has doubled from 10.9% in 2018 to 21.6% in 2022.
Influences on the 2022 results
-
For most of the coverage period of this report, workplace arrangements operated within former Australian Government policy frameworks that allowed for annual wage increases of 2% or 1.9%. The majority of employees received an annual wage adjustment under these policies.
-
Thirty-five percent of employees received a 3% wage increase under the Public Sector Interim Workplace Arrangements 2022 which took effect on 1 September 2022. The interim arrangements provided for employees to receive a one-off 3% wage increase when their next annual wage adjustment fell due. For most employees this adjustment occurred in 2023.
-
Any comparisons between non-SES weighted median Base Salary increases in 2022 (1.7%) and 2021 (3%) must take into account that in 2021 61% of non-SES employees received two wage increases, due to a six month deferral of wage adjustments applied in 2020. As a result most non-SES employees received total increases of between 3.7% and 4% in 2021 which drove the higher non-SES median increase for that year.
-
From 2021 to 2022 the number of ongoing non-SES engagements and promotions increased by 27% and 13% respectively. Newly engaged and promoted employees tend to commence on salaries at or near the bottom of their salary scale. This change to employee distribution across salary scales is a likely driver of the lower weighted non-SES median Base Salary increase, relative to wage increases in 2022.
-
The trend of repackaging motor vehicle related allowances into SES Base Salaries continued. The data suggests several agencies incorporated a motor vehicle related allowance into Base Salaries for some or all of their SES employees, resulting in large Base Salary increases for this group.
-
The gender pay gap across the APS is primarily driven by the higher proportion of females at lower classifications. There has, however, been a continued increase in female representation at higher classifications (EL 1 and above) since 2018, along with a slight decrease in the proportion of females at lower classifications. This trend is consistent with the narrowing gender pay gap over time.
-
The Performance Bonus Guidance – Principles governing performance bonus use in Commonwealth entities and companies continued in operation during 2022. The guidance sets out the Australian Government’s expectations that performance bonuses are used only in limited circumstances.
Footnotes
[1]For the purposes of determining whole-of-APS, non-SES and SES median percentage changes, medians of classifications are weighted to account for the number of employees at each classification to calculate an overall value for each group. These are referred to as weighted medians throughout this report. A weighted median differs from a median which is the actual midpoint of all values.
[2] Average Base Salary is only one measure used to examine remuneration by gender. Median Base Salary is also used in this report to measure differences in remuneration between men and women. See Chapter 8 for further information.