Chapter 7: APS Job Family Model
The APS Job Family Model
The APS Job Family Model groups job roles into related functions performed within the APS. Job family data is collected by the APSC and collated in the APS Employment Database.
The job family framework was updated in 2021 to be more aligned with the principles of an occupational taxonomy, by removing duplicate and obsolete roles and adding new relevant job roles aligned with the APS Professions. As a result, the job family model in previous reports will not be directly comparable in all cases.
As at 31 December 2022, data relating to job families had been provided for 84.6% of employees covered in this report. More information about the APS Job Family Model can be found on the APSC website.
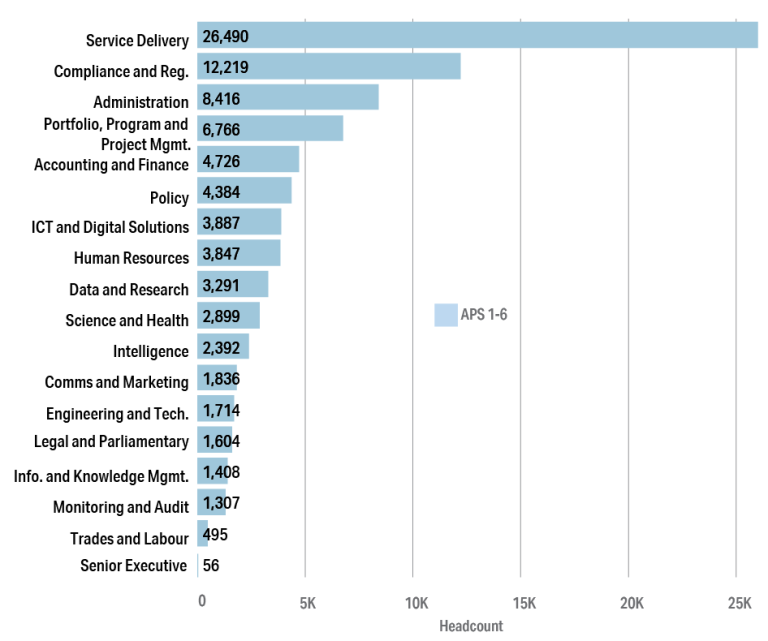
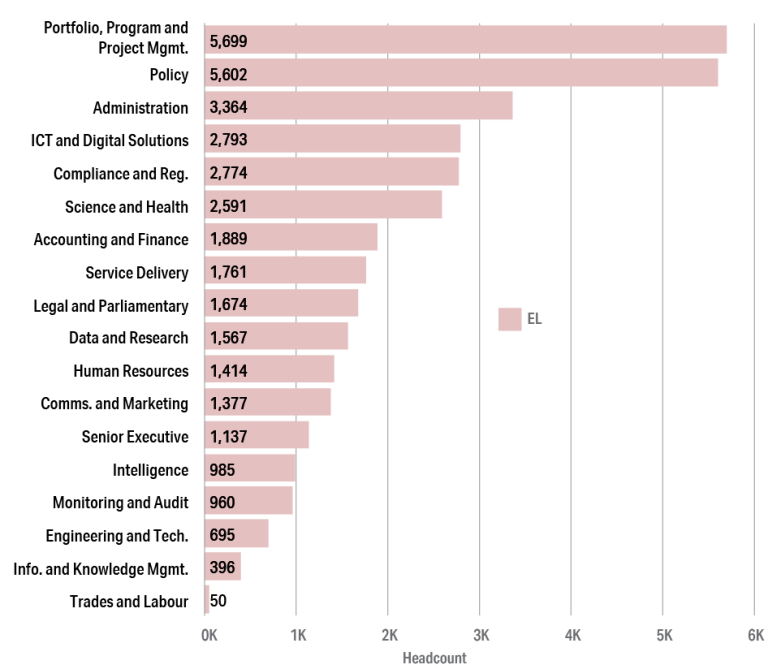
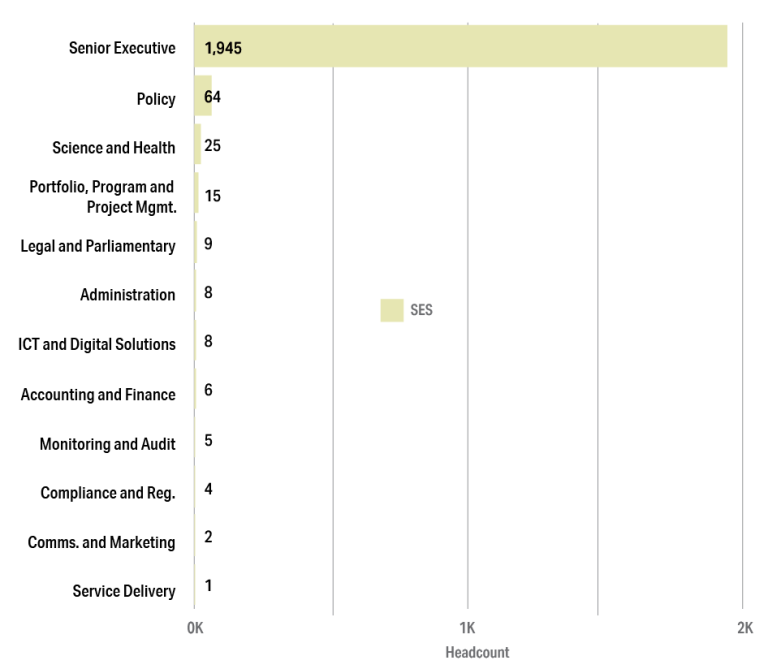
Table 7.1 shows the number of employees by APS job family. Service Delivery is the most common job family (22.3%), with the overwhelming majority of employees in this job family engaged at an APS level. This is followed by Compliance and Regulation (11.8%), Portfolio, Program and Project Management (9.9%) and Administration (9.3%). The largest proportions of EL employees are in the Portfolio, Program and Project Management and Policy job families. SES employees reside almost exclusively within the Senior Executive job family.
Table 7.1 Headcount of all employees by APS job family, 2022
| APS 1-6 | EL | SES | Total | |
|---|---|---|---|---|
| Service Delivery | 26,490 | 1,761 | 1 | 28,252 |
| Compliance and Reg. | 12,219 | 2,774 | 4 | 14,997 |
| Portfolio, Program and Project Mgmt. | 6,766 | 5,699 | 15 | 12,480 |
| Administration | 8,416 | 3,364 | 8 | 11,788 |
| Policy | 4,384 | 5,602 | 64 | 10,050 |
| ICT and Digital Solutions | 3,887 | 2,793 | 8 | 6,688 |
| Accounting and Finance | 4,726 | 1,889 | 6 | 6,621 |
| Science and Health | 2,899 | 2,591 | 25 | 5,515 |
| Human Resources | 3,847 | 1,414 | . | 5,261 |
| Data and Research | 3,291 | 1,567 | . | 4,858 |
| Intelligence | 2,392 | 985 | . | 3,377 |
| Legal and Parliamentary | 1,604 | 1,674 | 9 | 3,287 |
| Comms. and Marketing | 1,836 | 1,377 | 2 | 3,215 |
| Senior Executive | 56 | 1,137 | 1,945 | 3,138 |
| Engineering and Tech. | 1,714 | 695 | . | 2,409 |
| Monitoring and Audit | 1,307 | 960 | 5 | 2,272 |
| Info. and Knowledge Mgmt. | 1,408 | 396 | . | 1,804 |
| Trades and Labour | 495 | 50 | . | 545 |
Note: These numbers do not represent the total headcount in the APS Remuneration Survey data. Data on job families was provided for 84.6% of employees covered in this report.
Figure 7.1a Headcount of APS 1-6 employees by APS job family, 2022

Figure 7.1b Headcount of EL employees by APS job family, 2022

Figure 7.1c Headcount of SES employees by APS job family, 2022

Remuneration by APS job family
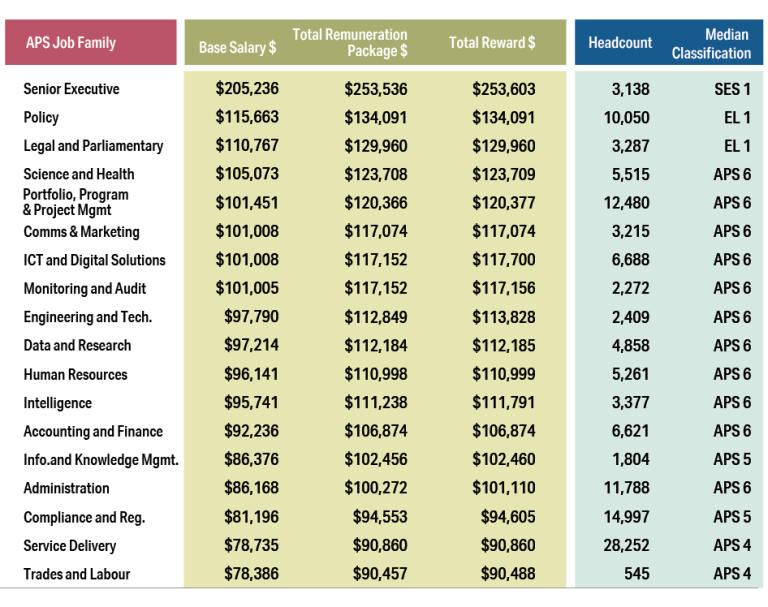
Figure 7.2 shows the median Base Salary, Total Remuneration Package and Total Reward by APS job family. Median salaries are highest for the Senior Executive, Policy and Legal and Parliamentary job families. This is consistent with a greater proportion of staff at higher classification levels being employed within these job families. Higher remuneration in a job family typically indicates higher classification levels are employed within that job family.
Figure 7.2 Median remuneration by APS job family, 2022


