Chapter 3: Base Salary
Base Salary is an employee’s full-time equivalent annualised salary. It includes salary sacrifice amounts such as pre-tax employee superannuation contributions made via salary sacrifice arrangements. It excludes bonuses and other benefits.
The weighted median Base Salary increase from 2020 to 2021 was 3% for the whole of the APS. This reflects weighted median increases of 3% for non-SES employees and 4.2% for SES (see Appendix A.3: Table 1b).
The Australian Government’s decision in 2020 to defer non-SES wage increases by six months in response to the COVID-19 pandemic had a substantial influence on non-SES Base Salary movement. Forty-two agencies, covering 61% of non-SES employees, had a 2020 increase deferred to 2021. These employees received two wage adjustments in 2021 with total increases ranging between 3.7% and 4% (most receiving 4%). Employees outside of this group received wage increases of up to 2%.
The weighted median SES Base Salary increase was 4.2%. This followed a decrease of 0.1% in 2020 after a Government decision to suspend all SES remuneration increases in response to the pandemic. A number of factors contributed to the 2021 increase including the following:
- SES employees are employed under individual arrangements negotiated directly with their agency. Employees may be offered, or negotiate, higher levels of remuneration or a different remuneration package on transfer or promotion to another agency.
- In June 2021, the Government lifted the suspension of SES remuneration increases. This allowed agencies to resume annual wage increases of 1.7% or 1.9% and performance-based salary progression (where available) for SES employees.
- There was a continued trend to incorporate motor vehicle related allowances into SES Base Salary in some agencies. From 2020 to 2021 the proportion of SES employees paid a motor vehicle related allowance decreased from 48.1% to 35.5%. Since 2017 the proportion of SES paid a motor vehicle related allowance has decreased from 68%. Movement in median Total Remuneration Package and Total Reward for SES employees was significantly lower than SES Base Salary movement, suggesting some repackaging of entitlements.
- One large agency moved staff onto new pay scales to align salaries of employees who moved to the agency, following a 2020 Machinery of Government change, with an existing SES salary scale.
- Given the small size of the SES cohort, population changes can easily impact median values. Almost one quarter of SES employees covered in this report were promoted, engaged or transferred at level during 2021 giving one in four SES employees the opportunity to negotiate a new individual arrangement.
Base Salary movement by classification
Table 3.1 shows percentage changes in median Base Salary by classification from 2020 to 2021. The median Base Salary increased across all classifications.
The highest median increase was 4.3% at the SES 2 classification followed by 4.2% for both the SES 1 and SES 3 classifications.
The highest non-SES median increase was 3.6% at the APS 4 classification.
The lowest median increase was 1.6% at the APS 2 classification.
Table 3.1 Base Salary by classification, 2020 and 2021
| P5 | Q1 | Median | % change | Q3 | P95 | ||||||
|---|---|---|---|---|---|---|---|---|---|---|---|
| 2020 | 2021 | 2020 | 2021 | 2020 | 2021 | 2020 | 2021 | 2020 | 2021 | ||
| Grad | $61,170 | $62,394 | $61,825 | $64,323 | $66,313 | $67,661 | 2% | $68,153 | $69,836 | $71,641 | $73,575 |
| APS 1 | $45,680 | $47,526 | $49,511 | $49,977 | $51,484 | $52,792 | 2.5% | $51,583 | $53,580 | $55,532 | $55,195 |
| APS 2 | $49,975 | $50,975 | $53,895 | $54,284 | $57,122 | $58,059 | 1.6% | $58,463 | $60,825 | $60,202 | $62,634 |
| APS 3 | $59,498 | $59,934 | $61,825 | $61,902 | $65,270 | $66,563 | 2.0% | $66,382 | $68,992 | $66,701 | $69,396 |
| APS 4 | $67,009 | $68,915 | $71,048 | $72,407 | $73,472 | $76,103 | 3.6% | $73,472 | $76,441 | $74,929 | $77,768 |
| APS 5 | $74,472 | $76,260 | $78,043 | $79,604 | $79,725 | $82,059 | 2.9% | $81,394 | $83,658 | $83,766 | $85,469 |
| APS 6 | $83,000 | $85,179 | $89,936 | $91,000 | $93,112 | $95,873 | 3.0% | $94,815 | $98,496 | $98,816 | $100,792 |
| EL 1 | $105,664 | $107,571 | $113,057 | $115,550 | $115,762 | $119,651 | 3.4% | $119,208 | $121,592 | $125,312 | $128,791 |
| EL 2 | $126,402 | $129,699 | $138,658 | $141,820 | $144,837 | $148,315 | 2.4% | $148,115 | $153,543 | $161,065 | $167,324 |
| SES 1 | $171,645 | $179,249 | $192,657 | $199,258 | $202,910 | $211,395 | 4.2% | $220,245 | $227,039 | $239,408 | $246,012 |
| SES 2 | $223,472 | $232,539 | $247,393 | $255,055 | $263,750 | $275,000 | 4.3% | $280,752 | $290,180 | $310,991 | $319,216 |
| SES 3 | $317,750 | $325,999 | $336,806 | $353,513 | $361,501 | $376,578 | 4.2% | $389,500 | $396,122 | $443,636 | $444,581 |
The relatively low APS 2 median increase of 1.6% may be explained by a high proportion of newly engaged or promoted employees commencing in the classification at the bottom of a salary scale. Due to the small number of employees at the classification median value is easily impacted.
There were consistently higher median increases across SES classifications compared to non-SES. These median movements were influenced by the factors outlined on page 5.
Other factors that may impact percentage changes are noted at Chapter 2. These include general wage increases, increment progression through salary scales, promotions, engagements and transfers between agencies.
Base Salary trends
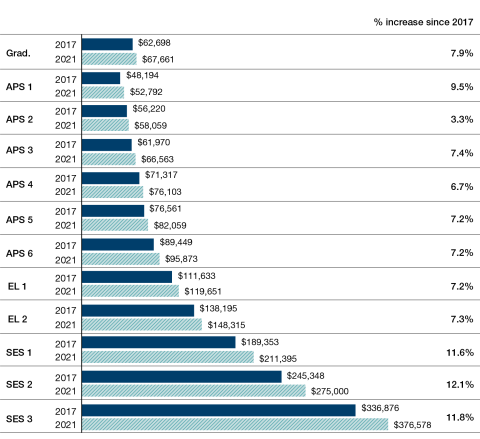
Figure 3.1 presents a comparison of median Base Salary by classification in 2017 and 2021. These are nominal figures, not adjusted for inflation. While all classification levels have seen Base Salary increases over the period, the pace of change continues to vary. Increases ranged from 3.3% at the APS 2 classification to 12.1% at the SES 2 classification.
Over the period, movement in Base Salary for SES classifications has remained higher than for non-SES. This reflects repackaging of allowances into SES Base Salaries over time. As such, these figures should be used with caution. Total Remuneration Package and Total Reward are more reliable long-term comparisons.
Figure 3.1 Median Base Salary by classification, 2017 and 2021

Base Salary range
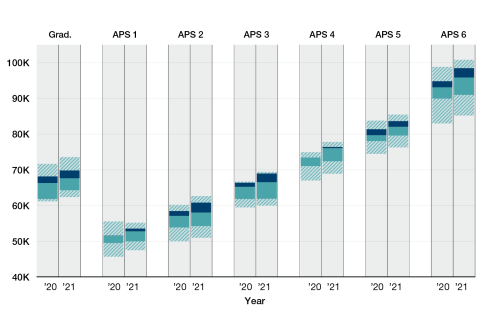
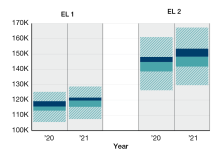
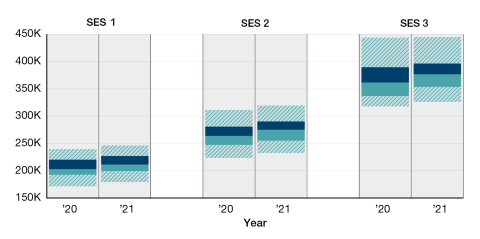
Figures 3.2a to 3.2c show changes in Base Salary ranges by classification from 2020 to 2021. See Appendix A.1 for notes on interpreting these figures.
There were increases across all non-SES classifications at all percentiles (except at the APS 1 level).
The APS 1 Base Salary range narrowed with a 4% increase at the 5th percentile and slight decrease of 0.6% at the 95th percentile. The increase at the 5th percentile is due to the promotion of a small number of employees on relatively low salary scales, out of the classification. As the APS 1 classification makes up only 0.2% of all employees it is subject to greater variations from population changes.
The range of values between the APS 4 median and 75th percentile (also known as Q3) increased slightly compared to 2020 when these values were identical. However, the distance between the median and 75th percentile remained smaller than other classifications reflecting the concentration of APS 4 employees in one large agency.
Figure 3.2a Base Salary range by classification, 2020 and 2021 (Graduate, APS 1-6)

Figure 3.2b Base Salary range by classification, 2020 and 2021 (ELs)

The EL 1 and EL 2 Base Salary ranges widened slightly with the greatest increases occurring at the higher end of the range.
For SES classifications, Base Salary ranges narrowed slightly. The highest percentile movements were in the lower half of the salary range. There was virtually no movement at the 95th percentile of the SES 3 classification.
Figure 3.2c Base Salary range by classification, 2020 and 2021 (SES)


