Chapter 8: Remuneration by gender
This chapter outlines key remuneration findings by gender. It uses two measures to examine remuneration:
- The first measure looks at remuneration by gender within each classification level to assess differences in remuneration for comparable work value.
- The second measure examines the gender pay gap for the APS overall.
In this chapter the median Base Salary is used for reporting differences in remuneration between genders by classification. The average Base Salary is used for reporting the overall difference in remuneration between genders in the APS to allow for comparison to other benchmarks such as the National Gender Pay Gap.
Remuneration by gender and classification[1]
The remuneration of males and females within each classification level is a measure which can be used to explore gender differences in remuneration for comparable work value based on the APS Classification Guide and Work Level Standards.
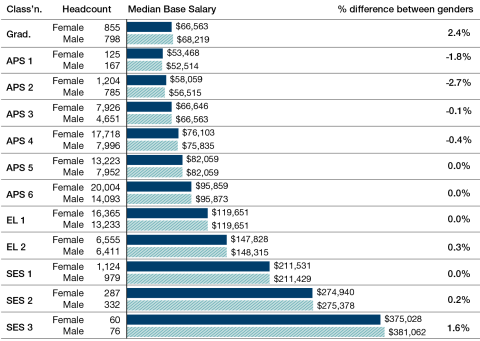
Figure 8.1 shows the differences between male and female median Base Salaries. The majority were within a range of +/-0.5%. A negative value indicates that females in this classification received a higher median Base Salary than males.
Figure 8.1 Median Base Salary by gender and classification, 2021

Note: The percentage difference between genders is the difference between male and female median Base Salaries expressed as a percentage of male earnings.
APS gender pay gap
The APS gender pay gap looks at gender remuneration results for the whole of the APS. The gender pay gap is the difference between male and female employees’ average weekly full-time equivalent earnings, expressed as a percentage of male earnings.
The APS calculation is based on the methodology used by the Australian Bureau of Statistics and the Workplace Gender Equality Agency. Using this methodology allows for the APS gender pay gap to be compared to other benchmarks such as the National Gender Pay Gap and the broader public sector, inclusive of States and Territories.
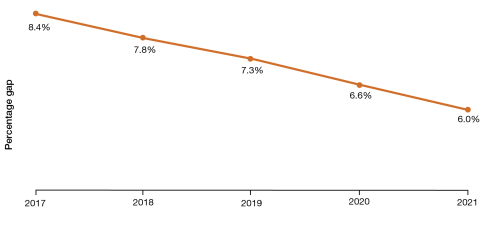
In 2021, the average Base Salary for males in the APS was $102,112 while the average Base Salary for females was $96,006. This represents a 6% gender pay gap for the APS and continues the improvement shown since 2017 (Figure 8.2).
As the data is annualised the higher proportion of women working part time hours is not reflected in the APS gender pay gap.
Figure 8.2 Average gender pay gap trends with data table, 2017 to 2021

| Female | 2017 | 2018 | 2019 | 2020 | 2021 |
|---|---|---|---|---|---|
| Average Base Salary | $86,529 | $88,896 | $91,016 | $92,536 | $96,006 |
| Headcount | 81,358 | 79,860 | 78,789 | 81,049 | 85,446 |
| Male | 2017 | 2018 | 2019 | 2020 | 2021 |
| Average Base Salary | $94,428 | $96,391 | $98,149 | $99,082 | $102,112 |
| Headcount | 57,949 | 55,928 | 54,500 | 55,622 | 57,473 |
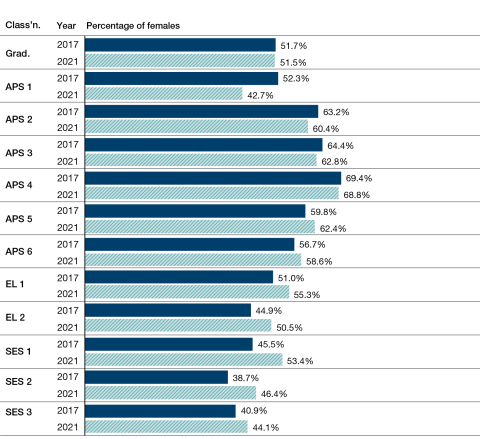
The gender pay gap across the APS may be primarily due to differences in the representation of males and females within each classification level. The data shows that women have historically been underrepresented at higher classification levels (EL 2 and above) and overrepresented at lower classification levels (APS 2–6). From 2020 to 2021, the representation of male and female employees at most senior classification levels moved further towards parity. In 2021, females represented over 50% of EL 2 and SES 1 employees.
Figure 8.3 shows how the proportion of females in each classification has changed over time. The data shows there has been a consistent increase in the proportion of females at higher classification levels (EL 2 and above) since 2017.
Figure 8.3 Females as a percentage of APS population by classification, 2017 and 2021

[1] Remuneration survey data used within this chapter does not include employees who identify as indeterminate/intersex/unspecified due to these numbers being statistically small.


