Chapter 5: Total Reward
Total Reward (TR) represents the full remuneration amount for each employee, less allowances.
TR is the sum of the Total Remuneration Package (TRP) plus bonuses. Bonuses include:
- individual performance bonuses
- sign-on bonuses
- productivity bonuses
- retention bonuses
- whole-of-agency or group performance bonuses
- fixed top-of-salary-range payments in lieu of increment progression.[1]
The weighted median TR increase from 2020 to 2021 was 2.7% for the whole of the APS. This reflects weighted increases of 2.7% for non-SES employees and 2.1% for SES (see Appendix A.3: Table 1b).
Total Reward movement by classification
Table 5.1 shows percentage changes in median TR by classification from 2020 to 2021. The median TR increased across all classifications and was similar to TRP movement.
The highest median increase was 4% at both the APS 1 and APS 4 classifications.
The SES 1, SES 2 and SES 3 medians increased by 2.2%, 2% and 1.6% respectively.
The lowest increase was 1% at the APS 2 classification.
TR values are close to those for TRP showing the small proportion that bonuses contribute to overall remuneration.
Table 5.1 Total Reward by classification, 2020 and 2021
| P5 | Q1 | Median | % change | Q3 | P95 | ||||||
|---|---|---|---|---|---|---|---|---|---|---|---|
| 2020 | 2021 | 2020 | 2021 | 2020 | 2021 | 2020 | 2021 | 2020 | 2021 | ||
| Grad | $69,330 | $72,003 | $73,287 | $74,229 | $76,230 | $77,515 | 1.7% | $78,439 | $80,682 | $82,973 | $84,906 |
| APS 1 | $52,715 | $54,724 | $57,063 | $57,673 | $59,430 | $61,831 | 4.0% | $62,306 | $63,695 | $68,048 | $67,281 |
| APS 2 | $57,696 | $59,797 | $62,293 | $62,990 | $66,354 | $67,000 | 1.0% | $70,289 | $72,018 | $73,779 | $75,841 |
| APS 3 | $68,661 | $69,164 | $72,491 | $71,686 | $76,524 | $77,496 | 1.3% | $79,243 | $80,232 | $85,096 | $86,330 |
| APS 4 | $77,136 | $79,528 | $82,707 | $84,028 | $84,787 | $88,213 | 4.0% | $87,799 | $90,768 | $91,484 | $94,135 |
| APS 5 | $85,709 | $88,042 | $90,542 | $92,182 | $93,026 | $95,733 | 2.9% | $96,370 | $98,624 | $100,601 | $102,741 |
| APS 6 | $96,250 | $98,368 | $104,278 | $105,930 | $108,793 | $111,596 | 2.6% | $113,078 | $115,502 | $118,769 | $121,563 |
| EL 1 | $122,127 | $124,150 | $131,190 | $134,230 | $136,693 | $139,382 | 2.0% | $140,122 | $144,113 | $149,048 | $152,137 |
| EL 2 | $147,083 | $150,554 | $162,541 | $165,636 | $170,592 | $175,706 | 3.0% | $177,050 | $181,846 | $198,853 | $202,500 |
| SES 1 | $226,282 | $231,387 | $242,576 | $246,801 | $254,996 | $260,601 | 2.2% | $267,394 | $273,250 | $291,719 | $297,553 |
| SES 2 | $289,109 | $296,235 | $309,475 | $316,807 | $322,740 | $329,099 | 2.0% | $343,705 | $347,620 | $387,126 | $383,199 |
| SES 3 | $391,499 | $389,653 | $415,423 | $421,772 | $442,155 | $449,310 | 1.6% | $459,079 | $467,871 | $530,174 | $512,612 |
Total Reward trends
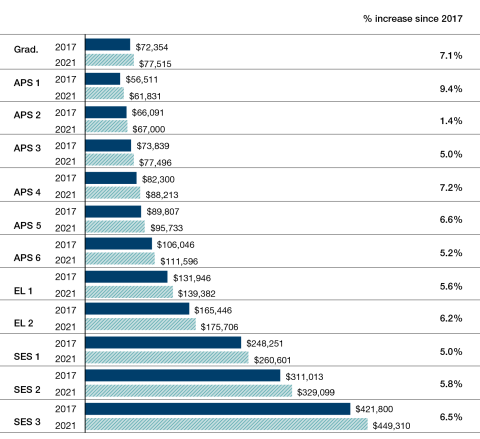
Figure 5.1 presents a comparison of median TR by classification in 2017 and 2021. These are nominal figures, not adjusted for inflation. Increases in TR are similar to those for TRP. Increases ranged from 1.4% at the APS 2 classification to 9.4% at the APS 1 classification. As with TRP, movement in TR for SES levels was lower than movement in SES Base Salaries, reflecting repackaging of remuneration components in previous years.
Figure 5.1 Median Total Reward by classification, 2017 and 2021
Total Reward range
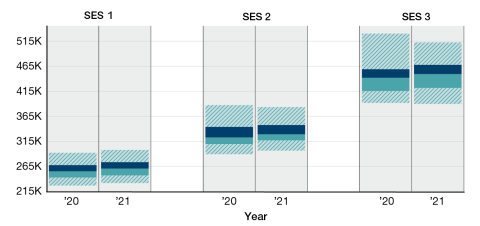
Figures 5.2a to 5.2c show changes in TR ranges by classification. Movement across percentiles was consistent with TRP movement. See Appendix A.1 for notes on interpreting these figures.
Figure 5.2a Total Reward range by classification, 2020 and 2021 (Graduate, APS 1-6)
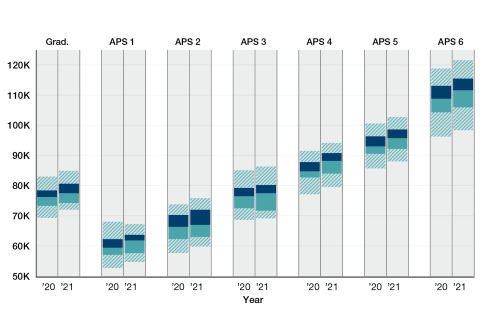
Figure 5.2b Total Reward range by classification, 2020 and 2021 (ELs)
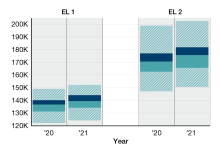
Figure 5.2c Total Reward range by classification, 2020 and 2021 (SES)
Performance bonuses
Reporting of performance bonuses was changed in 2021 to exclude payments that are not genuinely 'at risk' and variable based on performance.[2] The change in reporting reduced the number of payments reported as a performance bonus by 91%.
Some agencies have a provision in their enterprise agreement to make a fixed payment in lieu of salary progression to employees at the top increment of their salary range. These have made up the vast majority of payments reported as performance bonuses in previous reports. Almost all fixed top-of-salary-range payments are paid to non-SES employees. Fixed top-of-salary-range payments have been reported separately in 2021 (see Appendix A.3: Table 5a).
The overall median performance bonus paid in 2021 was $1,674, increasing from $922 in 2020. The increase in the median reflects the removal of modest fixed top-of-salary-range payments from the data.
The change in reporting has significantly impacted performance bonus numbers for non-SES employees. As a result, comparison to previous years’ non-SES performance bonus data is not meaningful.
Only 0.7% of non-SES employees (or 985 employees) were paid a performance bonus. Broken down by classification groups this represents 0.6% of Graduate and APS-level employees and 1% of Executive Level employees. The median non-SES performance bonus paid was $1,631.
Figure 5.3 Proportions of employees paid a performance bonus, 2021

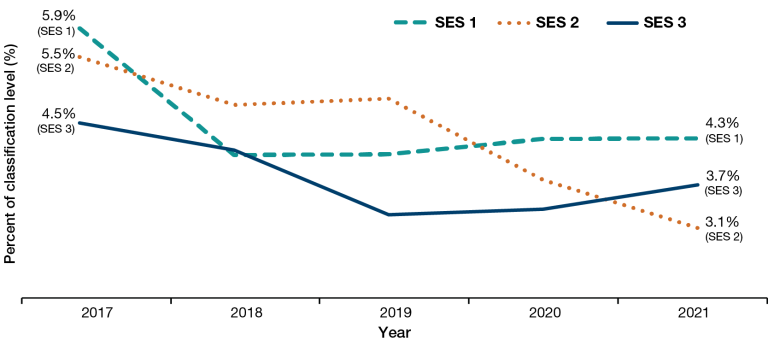
The proportion of SES employees paid a performance bonus remained relatively stable at 4% (115 employees) compared to 4.2% in 2020. The median SES performance bonus paid was $10,249.
Figure 5.4 shows the proportion of SES employees that received a performance bonus over a five year period broken down by classification. The overall proportion of SES employees that received a performance bonus decreased from 2017.
Figure 5.4 Proportions of SES employees paid a performance bonus, 2017-2021
[1] Fixed top-of-salary-range payments in lieu of increment progression were previously reported as performance bonuses. These have been reported separately for 2021 (see Appendix A.3: Table 5a)
[2] The reporting of performance bonuses was changed to align with the definition used in the Performance Bonus Guidance - Principles governing performance bonus use in Commonwealth entities and companies published on 13 August 2021.


